Monthly growth rates for the quantity bought in total retail sales - - PowerPoint PPT Presentation

monthly growth rates for the quantity bought in total
SMART_READER_LITE
LIVE PREVIEW

Monthly growth rates for the quantity bought in total retail sales - - PowerPoint PPT Presentation

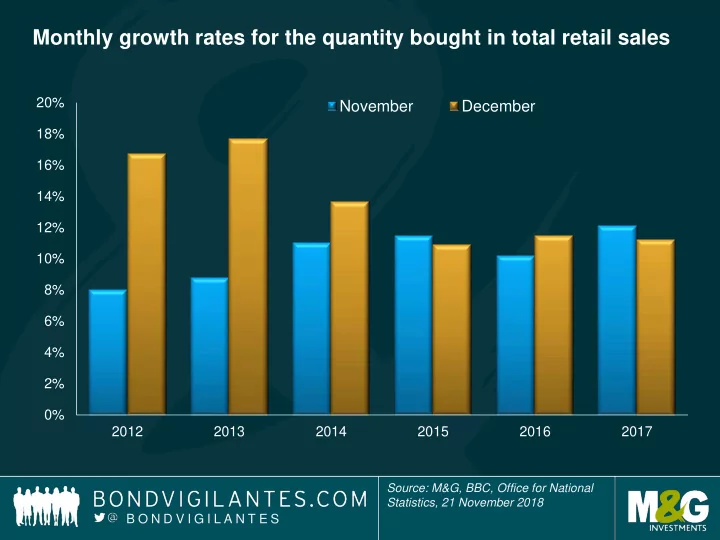
Monthly growth rates for the quantity bought in total retail sales 20% November December 18% 16% 14% 12% 10% 8% 6% 4% 2% 0% 2012 2013 2014 2015 2016 2017 Source: M&G, BBC, Office for National Statistics, 21 November 2018 B


slide-1
SLIDE 1

Source: M&G, BBC, Office for National Statistics, 21 November 2018

Monthly growth rates for the quantity bought in total retail sales

B O N D V I G I L A N T E S

0% 2% 4% 6% 8% 10% 12% 14% 16% 18% 20% 2012 2013 2014 2015 2016 2017

November December

slide-2
SLIDE 2

Source: M&G, Bloomberg, 21 November 2018

Bears are now in control of equity markets

B O N D V I G I L A N T E S

1750 1950 2150 2350 2550 2750 2950

S&P 500 200 day moving average

Bulls in control Bears in control

slide-3
SLIDE 3

Source: M&G, Bloomberg, 21 November 2018

Bond market sell-off

B O N D V I G I L A N T E S

  • 10.1%
  • 26.2%
  • 20.8%
  • 88.1%

80 85 90 95 100 Jun-18 Jul-18 Aug-18 Sep-18 Oct-18

British American Tobacco

70 75 80 85 90 95 100 105 Apr-18 May-18 Jun-18 Jul-18 Aug-18 Sep-18 Oct-18

General Electric

110 120 130 140 150

Telecom Italia

20 40 60 80 100 Jul-18 Aug-18 Sep-18 Oct-18 Nov-18

Cooperativa Muratori & Cementisti

slide-4
SLIDE 4

2,586 3,062 3,680 500 1000 1500 2000 2500 3000 3500 4000 2014 2015 2016 Total spending in million US Dollars

Total digital e-commerce spending in the US on Cyber Monday

Source: M&G, comScore