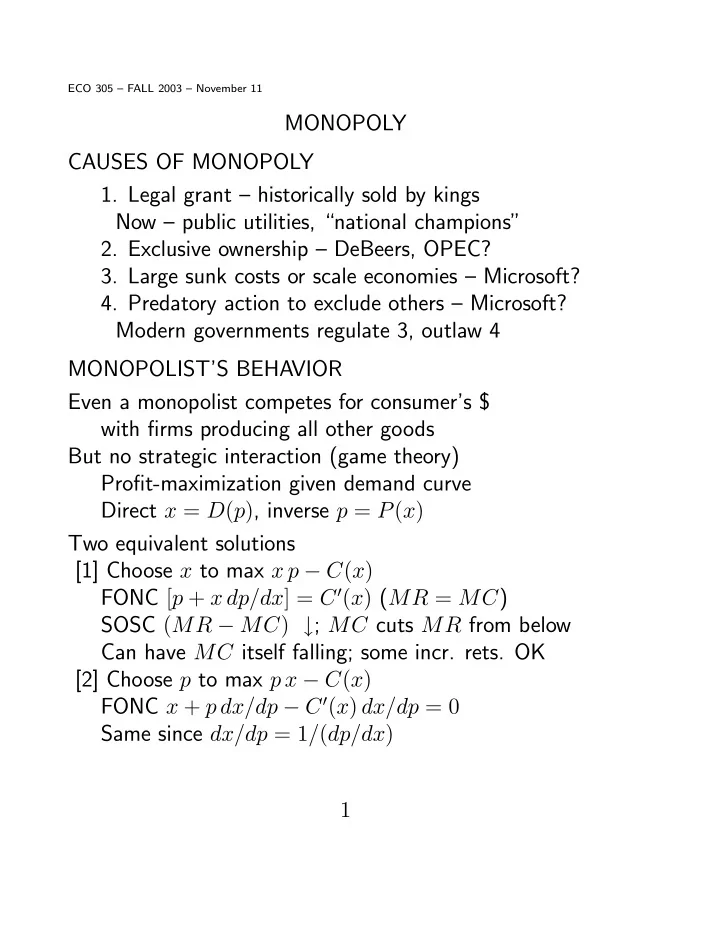

ECO 305 — FALL 2003 — November 11 MONOPOLY CAUSES OF MONOPOLY 1. Legal grant — historically sold by kings Now — public utilities, “national champions” 2. Exclusive ownership — DeBeers, OPEC? 3. Large sunk costs or scale economies — Microsoft? 4. Predatory action to exclude others — Microsoft? Modern governments regulate 3, outlaw 4 MONOPOLIST’S BEHAVIOR Even a monopolist competes for consumer’s $ with fi rms producing all other goods But no strategic interaction (game theory) Pro fi t-maximization given demand curve Direct x = D ( p ) , inverse p = P ( x ) Two equivalent solutions [1] Choose x to max x p − C ( x ) FONC [ p + x dp/dx ] = C 0 ( x ) ( MR = MC ) SOSC ( MR − MC ) ↓ ; MC cuts MR from below Can have MC itself falling; some incr. rets. OK [2] Choose p to max p x − C ( x ) FONC x + p dx/dp − C 0 ( x ) dx/dp = 0 Same since dx/dp = 1 / ( dp/dx ) 1
Elasticity of direct demand ² = − p dx MC dp, so mark-up p = x 1 − 1 /² Dead-weight loss because p > MC hence need for antitrust policy KEY TRADEOFF — Price ↓ / quantity ↑ implies pro fi t ↑ ( P − MC ) dx from marginal sales, ↓ x dp on inframarginal sales PRICE DISCRIMINATION — Attempt to escape tradeo ff [1] Perfect — separate price for each buyer, unit E ffi cient, but monopolist extracts all surplus Needs detailed info; must prevent resales 2
[2] Grouping — indiv. membership observable Separate, uniform price for members of each group Less info needed; must prevent resale Two-group case: max x 1 P 1 ( x 1 ) + x 2 P 2 ( x 2 ) − C ( x 1 + x 2 ) FONCs p 1 + x 1 dp 1 /dx 1 ≡ MR 1 = MC ≡ C 0 ( x 1 + x 2 ) p 2 + x 2 dp 2 /dx 2 ≡ MR 2 = MC ≡ C 0 ( x 1 + x 2 ) p 1 = MC / [1 − 1 /² 1 ] , p 2 = MC / [1 − 1 /² 2 ] Group with less elastic demand pays higher price e.g. airfare discounts for senior citizens [3] Versioning — individual demands unobservable But distribution in population known O ff er multiple “packages” Separate by self-selection (screening) e.g. Saturday night stay requirement in airfares May be easier to prevent resales Details later in information theory 3
OLIGOPOLY GENERAL ISSUES 1. How to de fi ne “industry” Close substitutes (or complements), matter of degree 2. Why is number of fi rms in industry small? Large fi xed costs or scale economies 3. Forms of strategic interactions a. Choice variables — quantities or prices Others — investment, R-and-D, advertising, ... b. Simultaneous vs. sequential actions leadership and followership advantage c. One-time vs. repeated interaction tacit collusion possible if repeated d. Explicit or implicit collusion or competition, depends on information, time-span, law, ... No combination of these universally true Study some special models for insight, techniques Key concept — Each fi rm’s price or quantity choice shifts others’ demand curves, a ff ects pro fi ts Like an externality, negative if substitutes Con fl ict between joint and individual pro fi t-max Result — game-theoretic interaction, equilibrium 4
DEMAND FUNCTIONS Result of maximizing quasilinear utility u ( x 1 , x 2 , y ) = 2 [ b 1 ( x 1 ) 2 + 2 k x 1 x 2 + b 2 ( x 2 ) 2 ] y + a 1 x 1 + a 2 x 2 − 1 subject to budget constraint y + p 1 x 1 + p 2 x 2 = M Inverse: p 1 = a 1 − b 1 x 1 − k x 2 , p 2 = a 2 − k x 1 − b 2 x 2 a i , b i > 0 , k 2 ≤ b 1 b 2 Substitutes: k > 0 , complements: k < 0 Perfect 1-for-1 substitutes: p 1 = p 2 = a − b ( x 1 + x 2 ) Direct: x 1 = α 1 − β 1 p 1 + κ p 2 , x 2 = α 2 + κ p 1 − β 2 p 2 α i , β i > 0 . κ 2 ≤ β 1 β 2 Substitutes: κ > 0 , complements κ < 0 Perfect 1-for-1 complements: x 1 = x 2 = α − β ( p 1 + p 2 ) QUANTITY-SETTING (COURNOT) DUOPOLY Constant marginal costs c 1 , c 2 ; fi xed costs “in background” Firm 1’s pro fi t Π 1 ( x 1 , x 2 ) = ( p 1 − c 1 ) x 1 = [( a 1 − c 1 ) − b 1 x 1 − k x 2 ] x 1 5
3-D and contour graphs ( a 1 − c 1 = 1 , b 1 = k = 1 ) 6
Recommend
More recommend