MOLECULAR MODELING OF EPOXY POLYMERS A. Bandyopadhyay, G.M. Odegard* - - PDF document

molecular modeling of epoxy polymers
SMART_READER_LITE
LIVE PREVIEW

MOLECULAR MODELING OF EPOXY POLYMERS A. Bandyopadhyay, G.M. Odegard* - - PDF document

18 TH INTERNATIONAL CONFERENCE ON COMPOSITE MATERIALS MOLECULAR MODELING OF EPOXY POLYMERS A. Bandyopadhyay, G.M. Odegard* Michigan Technological University, Houghton, MI, USA * Corresponding author (gmodegar@mtu.edu) Keywords : Molecular


slide-1
SLIDE 1

18TH INTERNATIONAL CONFERENCE ON COMPOSITE MATERIALS

  • 1. Introduction

Epoxy-based composite materials are of special interest in the aerospace industry for current and future aircraft and spacecraft. Although epoxy- based systems provide outstanding mechanical properties relative to other lightweight structural materials, little is known about how pure epoxy resins age with time. The influence of aging has been observed experimentally on epoxy resins, however, the influence of extended periods of moisture exposure and elevated temperatures are not completely understood on the molecular level. The

  • bjective of the current research is to develop

multiscale-modelling strategies to efficiently and accurately predict the mechanical response of epoxy materials and graphite/epoxy composites subjected to physical and chemical aging mechanisms.

  • 2. Modeling Procedure

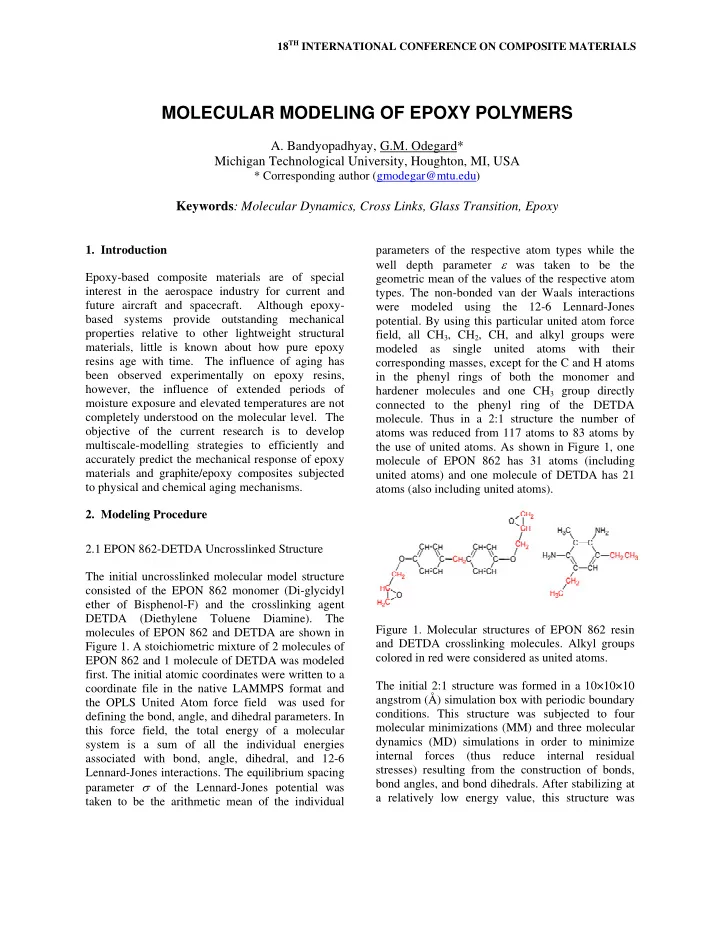
2.1 EPON 862-DETDA Uncrosslinked Structure The initial uncrosslinked molecular model structure consisted of the EPON 862 monomer (Di-glycidyl ether of Bisphenol-F) and the crosslinking agent DETDA (Diethylene Toluene Diamine). The molecules of EPON 862 and DETDA are shown in Figure 1. A stoichiometric mixture of 2 molecules of EPON 862 and 1 molecule of DETDA was modeled

  • first. The initial atomic coordinates were written to a

coordinate file in the native LAMMPS format and the OPLS United Atom force field was used for defining the bond, angle, and dihedral parameters. In this force field, the total energy of a molecular system is a sum of all the individual energies associated with bond, angle, dihedral, and 12-6 Lennard-Jones interactions. The equilibrium spacing parameter  of the Lennard-Jones potential was taken to be the arithmetic mean of the individual parameters of the respective atom types while the well depth parameter  was taken to be the geometric mean of the values of the respective atom

  • types. The non-bonded van der Waals interactions

were modeled using the 12-6 Lennard-Jones

  • potential. By using this particular united atom force

field, all CH3, CH2, CH, and alkyl groups were modeled as single united atoms with their corresponding masses, except for the C and H atoms in the phenyl rings of both the monomer and hardener molecules and one CH3 group directly connected to the phenyl ring of the DETDA

  • molecule. Thus in a 2:1 structure the number of

atoms was reduced from 117 atoms to 83 atoms by the use of united atoms. As shown in Figure 1, one molecule of EPON 862 has 31 atoms (including united atoms) and one molecule of DETDA has 21 atoms (also including united atoms). Figure 1. Molecular structures of EPON 862 resin and DETDA crosslinking molecules. Alkyl groups colored in red were considered as united atoms. The initial 2:1 structure was formed in a 10×10×10 angstrom (Å) simulation box with periodic boundary

  • conditions. This structure was subjected to four

molecular minimizations (MM) and three molecular dynamics (MD) simulations in order to minimize internal forces (thus reduce internal residual stresses) resulting from the construction of bonds, bond angles, and bond dihedrals. After stabilizing at a relatively low energy value, this structure was

MOLECULAR MODELING OF EPOXY POLYMERS

  • A. Bandyopadhyay, G.M. Odegard*

Michigan Technological University, Houghton, MI, USA

* Corresponding author (gmodegar@mtu.edu)

Keywords: Molecular Dynamics, Cross Links, Glass Transition, Epoxy

slide-2
SLIDE 2

replicated to form eight more structures within the simulation box so that a 16:8 molecular mixture of EPON 862 and DETDA monomers was established. A slow stress relaxation procedure was performed

  • ver a cycle of 20 MM and 10 MD simulations. All

MD simulations were conducted in the NVT (constant volume and temperature) ensemble for 100 picoseconds at 600 K. The NVT ensemble made use

  • f the Nose/Hoover thermostat and barostat for

temperature and pressure control, respectively. After every cycle of MD and MM, the box size was reduced by a small amount. After all MM and MD runs, a density of 1.21 g/cm3 (1210 kg/m3) was

  • achieved. The final pressure value of the last

minimization was less than 1 atmosphere (101,325 Pa) which indicated that the structure had almost no residual stress. This equilibrated structure was used for the subsequent crosslinking step. 2.2 Crosslinking Procedure The equilibrated structure of the 16:8 model was statically crosslinked based on the root mean square (RMS) distance between the N atoms of DETDA and CH2 groups of the EPON 862 molecules. Simultaneous breaking of CH2-O bonds in the epoxide ends of the EPON 862 molecules and N-H bonds of the DETDA molecules made the activated CH2 ends capable of forming crosslinks with activated N atoms of the DETDA molecules. A particular activated N could form a crosslink with the activated CH2 of any adjacent EPON 862 molecule within a specified cutoff distance. The crosslink density of the epoxy system was defined as the ratio of the total number of crosslinks that were formed to the maximum number that could be formed. For example, an epoxy network having 16 out of 32 crosslinks is defined as having a 50% crosslink density. Three representative crosslink densities were chosen for the subsequent modeling steps: 50% at a cutoff of 3.8 Å, 59% at a cutoff of 5 Å and 72% at a cutoff of 8 Å. These crosslink densities were chosen because they represent the expected range for a stoichiometric monomer/ hardener mixing ratio. 2.3 Modeling EPON 862-DETDA structure having 432:216 stoichiometric ratio The crosslinked 16:8 models were equilibrated by performing two MM minimizations and one MD run alternately to remove the residual stresses generated during the formation of the crosslinks. The MD runs were NVT simulations for 100 picoseconds at 500K. The equilibrated, crosslinked 16:8 models were replicated 26 times for each crosslink density, and each replica was rotated and translated to form a 3×33 array of 16:8 structures for each crosslink

  • density. The large systems had 432 molecules of

EPON 862 and 216 molecules of DETDA (Figure 2). Each of these three samples had 17,928 united atoms representing a total 25,272 explicit atoms. Figure 2. 432:216 model of EPON 862-DETDA containing 17,928 united atoms The models having a 432:216 monomer ratio of EPON 862 and DETDA chains were further equilibrated using MD and MM techniques with continuous shrinking of the volume until the models reached densities close to 1.2 g/cm3(1200 kg/m3). Between 30-35 minimizations and 12 NVT simulations were required for the equilibration of each individual 432:216 EPON 862-DETDA model. Once equilibrated, the models were further crosslinked based on RMS cutoff distance approach described above. The additional crosslinking steps were performed so that the 27 sub-units of the

slide-3
SLIDE 3

3 MOLECULAR MODELING OF EPOXY POLYMERS

molecular model were crosslinked with one another, thus creating a stable solid structure and increasing the crosslink densities further. The 50% crosslinked structure had a 54% crosslink density after this step, the 59% crosslinked structure became 63% crosslinked and the 72% crosslinked structure increased to 76%. It is important to note that the equilibrated structures model an infinite network of crosslinked epoxy due to the use of periodic boundary conditions. Therefore, the modeled structures do not represent localized crosslinking, which is observed in microgels with highly- crosslinked particles on the order of 10 Å.

  • 3. Results and Discussions

3.1 Glass transition temperature range determination For each of the three cross-linked epoxy models, NPH (constant pressure and constant enthalpy) simulations were run for 400 picoseconds from - 70oC (203K) to 330oC (603K) at pressures of 1 atm. These simulations were performed to simulate the process of constant heating of the epoxy systems from cryogenic temperatures to elevated

  • temperatures. Using the results of the NPH

simulations, density versus temperature curves were plotted which are shown in Figure 3 for the 54%, 63% and 76% crosslinked systems. The simulation data within the initial temperature range from -70oC to -30oC were discarded to eliminate the effects of molecular relaxation and initial oscillation of the temperature and pressure around the set values. The density-temperature curves showed a characteristic change in slope in the Tg region. Typically the Tg is determined by finding the intersection between linear regression lines fit to the data points below and above the change in slope. However, the change in slope is usually gradual. Therefore, it is more appropriate to describe the Tg as a temperature range rather than a single temperature value. To determine the Tg range, a series of linear regression lines were fit using temperature ranges of 80o, 90o, 100o, 110o and 120o C intervals of temperature for each of the crosslinked systems shown in Figure 3. The ranges

  • f the intersection points from these series of fits

comprised the Tg range. The values of Tg obtained for the three systems are given in Table 1. From the data it is clear that the average Tg increased as the crosslink density increased, which is likely due to the increasing number of covalent bonds as the crosslink density

  • increases. As a result, there is more resistance to

increases in free volume as the temperature increases for increased levels of crosslinking. Similar increases in Tg due to additional crosslinking have been observed in graphite-epoxy composites. In Figure 3, the density of the 54% crosslinked system is lower than that of the 76% crosslinked system at high temperatures, while this trend is

  • pposite at lower temperatures. 54% crosslinked

structure had more uncrosslinked freely-moving polymer chains that reoriented themselves into a dense configuration at lower temperatures. At high temperatures, the uncrosslinked epoxy chains can lead to more expansion of the volume and thus the 54% crosslinked structure had a lower density than the 76% crosslinked structure. All these NPH simulations were performed by using equilibrated configurations of these crosslinked systems. The equilibration process of the 63% crosslinked structure made its density slightly higher than the densities of the equilibrated 54% and 76% crosslinked structures. As the density was already a bit high before the NPH simulations were started, the 63% crosslinked structure’s density varied over a range which did not overlap the density variations of the other two systems. In this research, the focus was placed on the variations of the densities with respect to temperature, not on the absolute value of the densities. Varshney et al. predicted a Tg of 105°C for the same EPON 862-DETDA system but with a crosslink density of 95%. Fan et al. predicted the Tg for a 100% crosslinked EPON 862-DETDA system to be

  • 109oC. Miller et al. experimentally measured a Tg of

150°C for the same epoxy system, though the actual crosslink density was unknown. Clearly, the presently predicted values of all three crosslinked systems agree with the experimental values more than they agree with the predicted values in the

  • literature. Both Varshney et al.’s work and Fan et

al.’s work have predicted Tg values much less than experimentally measured values. This is especially surprising since the simulated cooling rates are much faster than the experimental cooling rate, which

slide-4
SLIDE 4

should lead to higher predicted values of Tg. The predicted values in the current study do not show such a discrepancy with experiment, which indicates that the chosen OPLS force field, equilibration process, and simulated heating process accurately modeled the molecular behavior of the epoxy system. Figure 3. Density vs. temperature curves for 54%, 63% and 76% crosslinked system 3.2 Volume Shrinkage and Thermal Expansion Coefficients Using the results from the NPH simulations described in the previous sub-section, the volume shrinkages with respect to the volume at 300oC for the 54%, 63%, and 76% crosslinked systems for the temperature range of -30°C to 300oC were determined and are plotted in Figure 4. From the plot it is clear that all three systems experienced significant changes in volume when heated to elevated temperatures. It is also clear that the 54% crosslinked system exhibited a significantly larger amount of shrinkage than the 63% and 76% systems, which were nearly identical. This is likely due to the difference in the number of covalent bonds present in the three structures. The 54% crosslinked structure had fewer covalent bonds and a larger number of free chains with higher mobility than the 63% and 76% crosslinked structures. Therefore, at decreasing temperatures, the 54% crosslinked model was able to adapt a more compact conformation than the 63% and 76% crosslinked models. Linear regression lines were fitted on the volume shrinkage curves shown in Figure 4 to determine the coefficient of volumetric thermal expansion (CVTE) in both the rubbery and glassy regimes. Because the method of fitting the data can affect the resulting predicted values of CVTE (similar to the predicted Tg described above), two different ranges were chosen to fit the curves for both the rubbery and glassy regions. In the glassy regime, the data were fit for the 0° - 120°C range and the 20° - 120°C degree

  • range. For the rubbery region, ranges of 160°C –

280°C degrees and 160° – 260°C degrees were fit. Figure 4. Volume shrinkages with respect to the volume at 300°C for 54%, 63% and 76% crosslinked structures Therefore, temperature ranges of 100° and 120°C were fit above and below the Tg, and the CVTE was calculated with

1

P

V V T          

(1) where V0 is the initial volume of the simulation box before the NPT simulation, and the subscript P implies a constant-pressure process. The coefficient

  • f linear thermal expansion (CLTE) is defined as

1 3

P

L L T            

(2) where L0 is the initial length of each side of the cubic simulation box before the NPH simulation. The CLTE values obtained for the three crosslinked systems are given in Table 2.

0.92 0.94 0.96 0.98 1.00 1.02 1.04 1.06 1.08 1.10 1.12 1.14 1.16 1.18

  • 40
  • 20

20 40 60 80 100 120 140 160 180 200 220 240 260 280 300 320 Density (g/cc) Temperature (degrees C) 54% Cross-Linked 63% Cross-Linked 76% Cross-Linked 2 4 6 8 10 12 14 16 18

  • 40
  • 20

20 40 60 80 100 120 140 160 180 200 220 240 260 280 300 320 Volume Shrinkage (dV/V X 100) Temperature (degrees C) 54% Cross-Linked 63% Cross-Linked 76% Cross-Linked

slide-5
SLIDE 5

5 MOLECULAR MODELING OF EPOXY POLYMERS

Table 1 – Predict glass transition values Crosslink density LTEC Below Tg ×10-5 LTEC Above Tg ×10-5 54% 12.9 20.0 63% 9.1 13.6 76% 8.6 14.0 Experiment4 6.4 18 Table 2 – Linear thermal expansion coefficients Crosslink density Shear modulus (GPa) Young’s modulus (GPa) Poisson’s ratio 54% 0.15 0.45 0.47 63% 0.71 1.96 0.39 76% 0.83 2.26 0.36 Experiment5 0.6-1.0 1.6-2.9 0.35-0.43 Table 3 – Predicted elastic properties 3.3 Elastic Properties Simulated deformations were performed on all three crosslinked systems to determine their elastic

  • properties. In these simulations, strains were

imposed on the periodic MD models in the NVT ensemble, and the corresponding averaged stress components (virial stress) were determined for a complete stress-strain response. Two types of strains were applied on the structures: volumetric and three- dimensional shear strains. NVT simulations were run at 300K (room temperature) for 200 picoseconds with timesteps

  • f

0.2 femtoseconds. Strain increments were applied at every timestep such that the desired cumulative strain was reached by the end

  • f the 200-picosecond simulation.

For the volumetric strains, equal strain magnitudes were applied in all three coordinate directions in both tension and compression according to the kinematic equation

0 005

xx yy zz

.       

(3) where ij is the infinitesimal strain tensor component with respect to coordinate directions i and j. The

  • verall dilation of the molecular model was

xx yy zz

      

(4) For each timestep in these simulations, the overall hydrostatic stress h of the model was calculated by

 

1 3

h xx yy zz

      

(5) where ij is the volume-averaged viral stress tensor component with respect to the coordinate directions i and j. For each timestep of the simulations, the hydrostatic stress and dilatation were used to perform a linear regression analysis to establish the bulk modulus. The bulk moduli calculated for positive and negative dilatations were averaged. Nearly one million data points were used to calculate the bulk modulus for each epoxy system. Similarly, a three-dimensional shear strain was applied to the molecular models

0 005

xy yz zx

.       

(6) where ij is the infinitesimal engineering shear strain component with respect to the i and j coordinate

  • directions. The corresponding volume-averaged

shear stresses yz, xz, and xy were calculated for each timestep. Each shear stress component was compared to the corresponding applied shear strain for each timestep of the simulations. A linear regression analysis was performed to determine the corresponding shear modulus. For each crosslink density, the three calculated shear moduli were averaged for both positive and negative applied shear strains. After calculating bulk moduli and shear moduli for all the crosslinked structures, Young’s moduli (E) and Poisson’s ratios () were

  • calculated. Using Equations 3-6, the

elastic properties were calculated for the 54%, 63% and 76% crosslinked structures and the values are given in Table 3. The bulk modulus shows a very small decreasing trend with increasing crosslink density, signifying that volumetric deformation probably does not have a strong sensitivity to crosslinking. The increasing trends in shear modulus and Young’s modulus with increasing crosslink density indicate that with crosslinking, the molecular structure becomes stiffer

Crosslink density Tg (°C) Method 54% 133 Current method 63% 142 Current method 76% 151 Current method 100% 109 MD1 95% 105 MD2 ? 150 Experiment3

slide-6
SLIDE 6

because of the presence of more covalent bonds. Similar trends have been reported in other epoxy systems by Gupta et al. and in epoxy-nanotube composites by Miyagawa et al. Lees and Davidson, Lee and Neville, and Burhans et al. discuss data that show increasing distances between reactive sites in epoxies result in decreasing crosslink densities and decreasing elastic properties. Another important

  • bservation is the similarity of shear modulus,

Young’s modulus, and Poisson’s ratio values of the 63% and 76% crosslinked structures. This similarity in mechanical properties is in agreement with the volume shrinkage results discussed above.

  • 4. Conclusions

The results of this study indicate that for this epoxy system, and possibly similar epoxy systems, there might be a range of crosslink density beyond which thermomechanical properties exhibit little change. At 63% crosslinking, the structure is already immobilized to a large extent and increasing the crosslink density to 76% may only change the thermomechanical properties slightly. Unfortunately, it is difficult to experimentally quantify the crosslink density of epoxies. The extent of cure can be monitored during the polymerization reaction using Infrared (IR) or dielectric spectroscopy. These techniques utilize changes in spectral features, such as the intensity of the epoxide group vibration (IR)

  • r the frequency of maximum permittivity or loss

(dielectric) to determine the progress of reaction. But these methods cannot determine the crosslink density for a cured epoxy sample. Without this data, it is difficult to make definitive statements regarding the validation of the observations in this study. A series of MD models have been developed for the same epoxy system exposed to various levels of physical aging. Because the process of physical aging cannot be modelled via MD simulation due to the drastic difference in time scales in ‘simulation’ and ‘simulated’ times, ‘snapshots’ of the molecular structure have been simulated for various aging

  • times. This has been achieved by simulating the

same material system as slightly different densities which correlate to different physical aging times. Using this modelling approach, the influence of physical aging on the Tg and elastic properties have been predicted. The predictions will be reported and compared to experiments to validate the modelling

  • strategy. A series of experiments are being

conducted to support and validate these simulations. Epoxy test specimens are currently being fabricated with various levels of physical aging. The elastic modulus, Poisson’s ratio, strength, and Tg will be measured using a uniaxial tensile frame, nano indentation, and Differential Scanning Calorimetry. An MD model is currently being developed to predict the molecular structure and strength of the epoxy/graphite fiber interface. The graphite fiber is modelled as a layered set of graphene sheets, and the polymer is crosslinked in the presence of the fiber

  • surface. It is expected that the density of the polymer

will depend on the distance from the graphite

  • surface. Also, the influence of hydrothermal aging

will be included in this model so the degradation of the fiber/matrix interface will be predicted as a function of aging time.

  • 5. Acknowledgement

This research was funded by NASA under the Aircraft Aging and Durability Project (Grant NNX07AU58A) and by the Air Force Office of Scientific Research under the Low Density Materials Program (Grant FA9550-09-1-0375). References

[1] H.B. Fan and M.M.F. Yuen “Material properties of the

cross-linked epoxy resin compound predicted by molecular dynamics simulation”. Polymer Vol. 48, No. 7, pp 2174- 2178, 2007.

[2] V. Varshney, S.S. Patnaik, A.K. Roy, B.L. Farmer “A

molecular dynamics study of epoxy-based networks: Cross- linking procedure and prediction of molecular and material properties”. Macromolecules Vol. 41, No. 18, pp 6837- 6842, 2008.

[3] S. Miller, J.L. Bail, L.W. Kohlman, W.K. Binienda

“Effects of Hygrothermal Cycling on the Chemical, Thermal, and Mechanical Properties of 862/W Epoxy Resin”. Aircraft Airworthiness and Sustainment Conference. Austin, TX, 2010.

[4] S.R. Wang, Z.Y. Liang, P. Gonnet, Y.H. Liao, B. Wang, C.

Zhang “Effect of nanotube functionalization on the coefficient of thermal expansion of nanocomposites” Advanced Functional Materials Vol 17, No. 1, pp 87-92, 2007

[5] J.D. Littell, C.R. Ruggeri, R.K. Goldberg, G.D. Roberts,

W.A. Arnold, W.K. Binienda “Measurement of epoxy resin tension, compression, and shear stress-strain curves over a wide range of strain rates using small test specimens”. Journal of Aerospace Engineering Vol 21, No. 3, pp 162- 173, 2008.