MOL2NET , 2018 , 4, doi:10.3390/mol2net-04-xxxx 2 Introduction - - PDF document

mol2net 2018 4 doi 10 3390 mol2net 04 xxxx 2 introduction
SMART_READER_LITE
LIVE PREVIEW

MOL2NET , 2018 , 4, doi:10.3390/mol2net-04-xxxx 2 Introduction - - PDF document

MOL2NET , 2018 , 4, doi:10.3390/mol2net-04-xxxx 1 MOL2NET, International Conference Series on Multidisciplinary Sciences MDPI http://sciforum.net/conference/mol2net-03 Assessment of the best operating conditions in the enzymatic hydrolysis of


slide-1
SLIDE 1

MOL2NET, 2018, 4, doi:10.3390/mol2net-04-xxxx 1

MDPI

MOL2NET, International Conference Series on Multidisciplinary Sciences http://sciforum.net/conference/mol2net-03 Assessment of the best operating conditions in the enzymatic hydrolysis of pretreated bagasse for bagasse ethanol. Carmen Salvador Pinos (pochasalvador@yahoo.com)a, Adalis Mesa Noval (amesa@uclv.cu)b, Fernando Batallas Merino (fernadobatallas@outlook.es)b, Jonathan Villavicencio Montoya (jfvm_1993@hotmail.com)b, Leyanis Mesa Garriga (leyanis.mesa@gmail.com)b y Erenio González Suárez (erenio@uclv.edu.cu)b.

aFacultad de Ciencias Médicas, Universidad Central del Ecuador bFacultad de Química y Farmacia. Universidad Central ―Marta Abreu" de las Villas

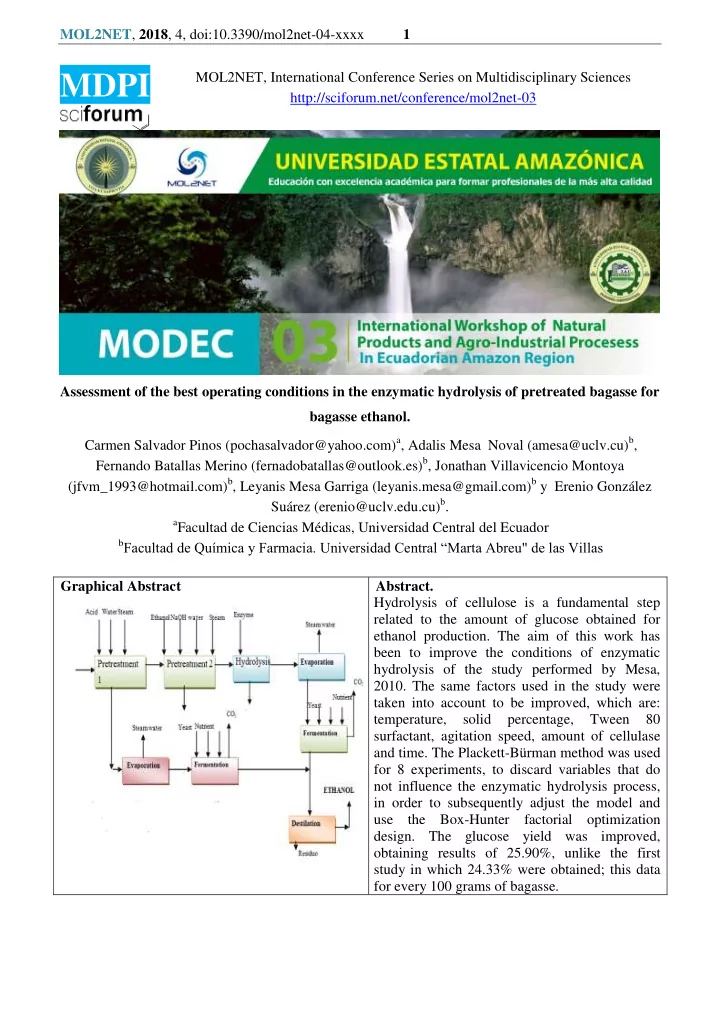
Graphical Abstract Abstract. Hydrolysis of cellulose is a fundamental step related to the amount of glucose obtained for ethanol production. The aim of this work has been to improve the conditions of enzymatic hydrolysis of the study performed by Mesa,

  • 2010. The same factors used in the study were

taken into account to be improved, which are: temperature, solid percentage, Tween 80 surfactant, agitation speed, amount of cellulase and time. The Plackett-Bürman method was used for 8 experiments, to discard variables that do not influence the enzymatic hydrolysis process, in order to subsequently adjust the model and use the Box-Hunter factorial optimization

  • design. The glucose yield was improved,
  • btaining results of 25.90%, unlike the first

study in which 24.33% were obtained; this data for every 100 grams of bagasse.

slide-2
SLIDE 2

MOL2NET, 2018, 4, doi:10.3390/mol2net-04-xxxx 2 Introduction There is great interest in the use of agroindustrial waste such as cellulignin as a raw material in the production of fuels and chemical products [1]. For some years there has been a need to reduce the fuel

  • btained from petroleum, so a wide range of materials has been used, among them, lignocellulosic

waste are used to produce second-generation biofuels that do not compete with food, these are then considered sustainable. In order to convert the lignocellulosic material into second generation bioethanol, there are four important operations: pretreatment of waste biomass, enzymatic hydrolysis into fermentable sugars and the separation of wastes into ethanol. Once the ethanol has been obtained, the first obstacle to lower the costs of the fuels that come from lignocellulosic biomass is the use in the enzymatic hydrolysis of highly expensive enzymes [2]. Generating conditions in the hydrolysis that avoid the deactivation of these components or optimizing the hydrolysis conditions in order to obtain a higher glucose yield could be beneficial, coming from the understanding of the functioning of the enzyme in relation to the factors that influence the hydrolytic process. Furthermore, the deactivation of cellulases plays a restrictive role in the efficient conversion of biomass into fermentable sugars and other

  • products. A potential strategy to increase the hydrolytic efficiency of cellulases could be the

development of technologies to avoid the inactivation of components of commercial cellulase preparations [3]. Processes on an industrial scale differ from laboratory scale investigations in some facts such as the following: the parameters of the laboratory process can be carefully controlled, but in the industry excessive control is very expensive, and the volumes of water and buffer solutions for optimizing conditions are unsustainable on an industrial scale. For these reasons it is necessary to recycle the streams of the process to minimize the requirements of fresh water and therefore decrease the amount

  • f wastewater produced [4,5].

Materials and Methods Pretreatment of the lignocellulosic material Sugar cane bagasse (60% w/w) was collected in Puyo, Ecuador. In order to be used in the experiments, it was chopped until a size of 1,5 mm. was reached. The composition of the material in relation with the percentage of dry matter was: glucan, 49.0%; xylan, 15.6%; lignin 27.24%. Acid Hydrolysis In this treatment, 500 grams of bagasse were placed with 1,25% sulphuric acid (w/w), and were treated in an autoclave for 40 minutes at 134ºC y 2 atmpressur. Relation bagasse to sulphuric acid was 1:10. The liquor was collected, the sample was washed with water in a proportion of 1:1 and filtered.

slide-3
SLIDE 3

MOL2NET, 2018, 4, doi:10.3390/mol2net-04-xxxx 3 Basic hydrolysis-organosolv As a product of the filtered mass, the cake was obtained, to which ethanol at 30% was added and 7%

  • f concentrated NaOH on dry fiber. The relation bagasse-NaOH is 1:7; this was placed in the

autoclave at 175ºC for 90 minutes. The pre-treated solid was washed with water to remove ethanol and alkali, it was dried at for 4 hours at 40 °C, and the sample was analyzed to find the remnants of glucose, xylose and lignin content [6]. Enzymatic hydrolysis The enzymatic hydrolysis has been carried out taking into account the parameters found in Table 1.

  • Tabla1. Factors analyzed in the study of enzymatic hydrolysis of a commercial enzyme.

Factors Description Lower level Higher level X1 Temperature (°C) 35 50 X2 Enzyme load (FPU) 10 25 X3 Stirring speed (rpm) 150 200 X4 Time (hours) 15 24 X5 Solid percentage 5% 33% X6 Tween 80 (g) 0,1 0,2 Laboratory analysis According to the proposed procedures, the best enzymatic hydrolysis conditions were determined with commercial enzymes starting from the experience garnered by Mesa in 2016 [7], including the glucose yield per 100 grams of raw material as a response parameter, with the goal of taking advantage on cellulose composition, which is a polysaccharide, made up by β-1,4glycosidic linkages [8]. Glucose concentration was analyzed in HPLC, with the Sugar Pack technique. An aspect of singular importance is the combination of experimental rehearsals proposed by González and collaborators [9]. In fact in the figure 1 the range of more efficient use of the factorial designs is shown [10]. Experimental design Independent Variables for be investigated 2 3 4 5 6 7 8 9 10 11...... n Graphical models Full factorial Fractional factorial Saturated fractional factorial Figure 1.Range for efficient use of experimental design [10]

slide-4
SLIDE 4

MOL2NET, 2018, 4, doi:10.3390/mol2net-04-xxxx 4 The experimental matrix of Plackett-Bürman [11] was proposed on the basis of the analysis carried out for the enzymatic hydrolysis with the commercial enzyme in order to determine the significance of each of the variables. It is shown below in Table 2. Table 2. Plackett-Bürman experimental matrix. Test/Variables X1 X2 Xf X3 X4 X5 X6 1 + + +

  • +
  • 2

+ +

  • +
  • +

3 +

  • +
  • +

+ 4

  • +
  • +

+ + 5 +

  • +

+ +

  • 6
  • +

+ +

  • +

7

  • +

+ +

  • +
  • 8
  • Results and Discussion

The glucose yields considered as Yn are detailed in Table 3. To understand the incidence of the factors under study, they were related to said glucose yields through the designs proposed in the experimental

  • plan. The temperature levels (35 ºC -50 ºC) that were established allow the enzymatic hydrolysis to

take place at the optimum temperature of the commercial enzyme (around 50°C); the best temperature conditions are those recommended by the manufacturer of the product. Generally, these enzymes are capable of resisting higher temperatures than the native enzymatic cocktails; the decrease in temperature decreases the glucose yield. It has been reported that enzymes have greater activity in the higher temperature range [12-14]. Regarding the enzyme load (10UPF/g—25UPF/g), or enzyme capacity in FPU (Filter Paper Unit), corresponds to a conversion of 1 μmol substrate in 1 minute, which forms 1 μmol/min of reducing sugars measured as glucose reducing power. Theoretically, the concept explains that the greater the amount of enzyme, the greater the degradation of the lignocellulosic substrate and therefore the greater amount of glucose. This study confirms this proposition, obtaining beneficial results in the range of 25 FPU/g, which is the most adequate amount to achieve better glucose yields as reported by authors such as [1]. The surfactants affect the enzymatic activity, helping to prevent cellulases from being inhibited. Specifically, Tween 80 contributes to the activation of cellobiohydrolase [3]. The amount of surfactant in the levels studied was not significant, which shows that it can be used in the lower range. Regarding the stirring speed in revolutions per minute (rpm), even though it homogenizes the reaction system causing that the contact surfaces of the substrate are available to interact with the enzyme, in the stirring ranges studied (150-200 rpm), this variable was not significant. With respect to this, it has been described that enzymes work much better with agitation, projecting higher glucose yield results [14], which so occurred in this study. However, no benefits were obtained regarding the response variable of glucose concentration.

slide-5
SLIDE 5

MOL2NET, 2018, 4, doi:10.3390/mol2net-04-xxxx 5 The hydrolysis time span is related to the moment in which the cellulose fiber is able to be converted in glucose due to the enzymatic action. The enzymatic reaction time considered (15-24 hours) was taken into account because, from the moment the enzyme comes into contact with the surfaces of the substrate, the enzyme activation and the cellulose unfolding begins. Previous studies found good yields in a time of 24 hours [15], but in this study it was found that in fact at 15 hours there is already a concentration of glucose that can be used for fermentation, which influences the industrial process times. The solid percentage (5 and 8%) that was used was selected because an attempt was made to minimize the volume of water increasing the solid percentage, due to the high volumes of water used in the laboratory, which makes the process unsustainable at an industrial scale. The high efficiency of commercial enzymes in the pretreated bagasse and the pretreatment that facilitates the bagasse fibers to be in the best conditions for the enzymatic attack with small volumes of water were also considered. In addition, according to a study carried out in the analytical laboratory of renewable energy procedures, there are results of glucose yields using a load of solids of 2% w/v [16]. However, it is not optimal in model tests for the industry. Other tests recommend maintaining a load of solids between 6 and 10% to achieve high yields [1]. Some authors ratify a very acceptable yield using (5% w/v) [17,18]. In this study, it was found that it is possible to work with proportions of 1:2, solid material (bagasse of lignocellulosic residues with moisture percentage) in 2 volume proportions of water/buffer for hydrolysis. The results obtained in the planned experiment, Table 3, show that the best test is 2, which has 25.90 g glucose yield per 100g of bagasse. Therefore, the conditions presented by the trial, in relation to the factors involved for the degradation of the lignocellulosic material were the best. Similar yields were

  • btained in a study conducted by [14] in which the yield obtained was 24.33 g glucose yield per 100g
  • f bagasse. It is observed that there is a slightly better performance. Perhaps a significant phenomenon

is that in test 2 this yield is obtained at 15 hours, which is industrially interesting, because it decreases the hydrolysis time, which implies an improvement in the production time. The least significant variables were stirring speed and Tween 80 for the levels studied. Table 3. Experimental results for glucose yield in 100g of bagasse obtained for the different experimental responses. Test X1 X2 XF X3 X4 X5 X6 Y (g/100g) Y Equation Y Average 1 1 1 1 -1 1 -1 -1 19,76 20,69 20,22 2 1 1 -1 1 -1 -1 1 25,90 24,97 25,44 3 1 -1 1 -1 -1 1 1 6,13 6,47 6,30 4

  • 1 1 -1 -1 1

1 1 8,2 7,86 8,03 5 1 -1 -1 1 1 1 -1 5,3 4,92 5,09 6

  • 1 -1 1

1 1 -1 1 3,00 3,93 3,46 7

  • 1 1

1 1 -1 1 -1 14,80 15,13 14,96 8

  • 1 -1 -1 -1 -1 -1 -1

9,4 8,46 8,92

slide-6
SLIDE 6

MOL2NET, 2018, 4, doi:10.3390/mol2net-04-xxxx 6 The glucose yield coefficient for the studied factors is presented below in Table 4: Table 4. Glucose yield coefficient for the enzymatic cocktail. E1 E2 EF E3 E4 E5 E6 5,420 11,221

  • 1,2608

1,3699

  • 4,405607
  • 5,9151
  • 1,492

For this, the model equation was calculated: Plackett-Bürman Model Y= Eo+1/2[E1*x1+E2*x2+E3*x3+E4*x4+E5*x5+E6*x6] When implementing the Plackett-Bürman model through the use of glucose performance coefficients, the variables that are not significant in the experiment could be observed, thus allowing to discard the mentioned conditions, so optimizing the enzymatic hydrolysis process [10]. The standard error is obtained by calculating the false variables, estimated as identical as in the case of the real variables, as follows: SE=√

The simplification of each effect is verified by comparing the tabulated value of the Student's t to F/number of false variables and the calculated result of the expression: T= So if the calculated value is greater than the tabulated value, this means that the effect of the level variation of the independent variable actually causes variations in the response parameter, and that this is not due to experimental errors, which according to the degree of significance of the variable, the computer will write, depending on if it is significant P = 80, 85, 90, 95%. The E3, stirring, is not significant because the amount of bagasse that enters the process, when mixed with the enzymatic cocktail of bacteria, forms a cake that makes stirring difficult. This saccharification begins as a semi-solid hydrolysis. In Table 4 it is observed that EF (false variable) and E3 (stirring) are not significant for the experiment, therefore the false variable is discarded. Once condition X3 (stirring) is discarded, a fractional factorial design is carried out, taking into account the conditions that influence the experiment. Box-Hunter optimization design [19]. Here the idea is used proposed by [9] that the results of the rehearsals of a womb Of Plackett-Bürman

  • f a first experiment can be used once in the determination of the effect of the independent variables

and the verification of the adequacy of the lineal pattern you discard the non significant variables of the original design. Fractional factorial design in the enzymatic hydrolysis of a commercial enzyme with conditions adjusted to the experimental data obtained in laboratory. Table 5

slide-7
SLIDE 7

MOL2NET, 2018, 4, doi:10.3390/mol2net-04-xxxx 7 Tabla 5. Box-Hunter optimization design 24-1for glucose yield. Test Order X1 X2 X4 X5 1 8 + + +

  • 2

2 + +

  • 3

4 +

  • +

4 5

  • +

+ + 5 7 +

  • +

+ 6 1

  • +
  • 7

3

  • +
  • +

8 6

  • Here, a defined contrast is established of the kind:X5 = -X1X2

Then a relationship is generated of the kind:1=-X1X2X5 Which produces the following effects of mixture of the independent variables: b1 = ß1 – ß25, b2 = ß2 – ß15, b4= ß4 – ß1245, b5= ß5 – ß12, b14=ß14 –ß245, b24=ß24 –ß145 b45=ß45 – ß124, The model then is set as follows: Y: b1X1 + b2X2 + b4X4 + b5X5 + b14X1X4 + b24X2X4 + b45X4X5. This allows to ensure that the model for the estimation will have the terms corresponding to the independent variables due to the effects of the interactions appear mixed with those from the dependent terms. The data adjusted for glucose yield after replication, by means of the fractional optimization design, and taking into account the factors that influenced the enzymatic hydrolysis process, are shown in Table 6., by discarding conditions, the costs of processes will be improved, thus obtaining an

  • ptimization in production.

The experimental results are presented in Table 6. Tabla 6. Factorial design for commercial enzymes Test Y´ Y´´ Y Average 1 19,80 20,22 19,99 2 25,90 25,43 25,67 3 6,13 6,30 6,22 4 8,20 8,03 8,11 5 5,30 5,09 5,17 6 3,01 3,46 3,23 7 14,82 14,96 14,88 8 9,40 8,92 9,15 Reproducibility Variance ∑(Y)2/8= 0,118 Once the conditions that influence the experiment are considered, the average between tests Y' and Y'' is calculated, and compared with the result obtained when performing the Box-Hunter model equation, thus obtaining the experimental errors for each of the trials.

slide-8
SLIDE 8

MOL2NET, 2018, 4, doi:10.3390/mol2net-04-xxxx 8 The glucose yield coefficients of the enzymatic hydrolysis for the mixture of commercial enzyme with the enzymatic cocktail of Bacillus sp bacteria were evaluated according to the Box-Hunter model. They are shown in Table 7. Tabla 7. Glucose yield coefficients of enzymatic hydrolysis with commercial enzyme b1 b2 b4 b5 b24 b45 2,7100 3,561

  • 2,499
  • 2,957
  • 0.68

0.47 Testing significance of coefficients The significance of each coefficient is tested separately by using ―Student`s test (t). It was found that the cellulase load (b2) and solid percentage(b5) are the most significant factors, so it is recommended to work with the highest level of enzyme and highest percentage of bagasse. The experimental results and the estimates of the Box-Hunter model are presented in Table 8. Tabla 8. Factorial design for commercial enzymes Test Y Average Y Equation Squared difference 1 19,996 19,997 0,0000008 2 25,669 25,671 0,0000050 3 6,217 6,371 0,0237006 4 8,114 7,946 0,0280723 5 5,175 5,246 0,0050399 6 3,232 3,445 0,0454021 7 14,881 14,870 0,0001159 8 9,151 9,354 0,0414009 Adequation Variance ∑(Yad)2= 0,021 According to these results, Fisher's test calculated as 2 in 8 will be = 0058, which is less than Tabulated 1.86 [20]. And it is considered that the model is adequate to predict the results. On the basis of the yields obtained, if it is then found that the cost of the commercial enzyme per liter

  • f ethanol is $ 0.059, by implementing a smaller amount of enzyme because hydrolysis has been

improved, there will be a benefit by saving in production capital. Conclusions 1) These results have produced information that allows to improve the enzymatic hydrolysis process with yield values of 25,9 in 100 grams of bagasse.

2) Stirring speedand amount of Tween 80, according to the study results, can be considered in the

lowest rank for the levels studied.

3) The optimization of hydrolysis conditions is an alternative to decrease production costs.

References 1. Peñuela, M.N., J; Becerra, M; Pereira N. Enzymatic hydrolysis optimization to ethanol production by simultaneus saccharification and fermentation. Biochem Biotechnol 2007, 141- 154.

slide-9
SLIDE 9

MOL2NET, 2018, 4, doi:10.3390/mol2net-04-xxxx 9 2. Brethauer, S.C., Wyman. Continuous hydrolysis and fermentation for cellulosic ethanol

  • production. Bioresource Technology 2010, 4862-4874.

3. Donglin, X.M., Yang; Xiang, Chen; Ying, Zhang; Juhua, Zhang. Improving the hydrolytic action of cellulases by tween 80: Offsetting the last activity of cellobiohydrolase cel 7a. Sustainable Chemistry Engineering 2017, 11339-11345. 4. Galbe, M.G., Zacchi. Simulation of ethanol production based on enzymatic hydrolysis og lignocellulosic materia using aspen plus. Biochem Biotechnol 1993, 639-649. 5. Larsson, M.Z., G. Recirculation of process water in the production of ethanol from softwood. Bioresource Technoogy 1997, 143-151. 6. Sidiras, D.S., Ioanna. Organosolv pretreatment as a major step of lignocellulosic biomass

  • refining. In I conferences of lignocellulosic biomass, Chania-Grecia, 2015.

7. Mesa, L.G., Erenio; Cara, Cristobal; Castro, Eulogio; Mussatto, Solange. An approach to cellulase recovery from enzymatic hydrolysis of pretreated sugarcane bagasse with high lignin

  • content. Biocatalysis and Biotransformation 2016, 1-11.

8. Cuervo, L.F., Jorge; Quiroz, Rosa. Lignocelulosa como fuente de azúcares para la producción de etanol. Biotecnologia 2009, 11-25. 9. Gonzalez, E.R., Fernando; Ribot, Angel; Peralta, Luis. Combinacion de los metodos de diseño experimental en la minimizacion de los ensayos de una investigacion. Tecnología química 1986, 11-17. 10. Isaacson, W. Statistical analysis for multivariable systems chemical engineering. Chemical Engineering 1970, 67-74. 11. Plackett, R.B., J. The design of optimum multifactorial experiments. Biometrika 1946, 305- 325. 12. Ruegm, M.T., L. Actividad de las celulasas de hongos aislados de suelos de la estación ecologica de sao paulo‖, brasil. Journal of botany 2004, 306-315. 13. Baig, M.Y., M. Saccharification of banana agro-waste by cellulolytic enzymes. African Journal

  • f Biotechnology 2004, 447-459.

14. Mesa Garriga, L. Estrategia investigativa para la tecnologia de obtencion de etanol y coproductos del bagazo de la caña de azucar. Universidad Central Marta Abre de Las Villas, Santa Clara, 2010. 15. Lin, L.Y., Rong; Liu, Yongqiang; Jiang, Wenju. In-depth investigation of enzymatic hydrolysis

  • f biomass wastes based on three major components: Cellulose, hemicellulose and lignin.

Bioresource Technology 2010, 8217–8223. 16. Zhang, H.Y., Guangying ; Wei, Yutuo; Li, Xin; Zhang, Aiping; Xie, Jun. Enhanced enzymatic hydrolysis of sugarcane bagasse with ferric chloride pretreatment and surfactant. Bioresource Technology 2017, 396-404.

slide-10
SLIDE 10

MOL2NET, 2018, 4, doi:10.3390/mol2net-04-xxxx 10 17. Buaban, B.I., Hiroyuki; Yano, Shinichi ; Tanapongpipat, Sutipa; Ruanglek, Vasimon; Champreda, Verawat; Pichyangkura, Rath; Rengpipat, Sirirat; Eurwilaichitr, Lily. Bioethanol production from ball milled bagasse using an on-site produced fungal enzyme cocktail and xylose-fermenting pichia stipitis. Journal of Bioscience and Bioengineering 2010, 18-25. 18. Rodrigues, A.G., M. Cellulase stability, adsorption/desorption profiles and recycling during successive cycles of hydrolysis and fermentation of wheat straw. Bioresource Technology 2014, 163-169. 19. Box, G.H., J. The key k-y fractional factorial desing. Techometrics 1961, 333-340. 20. Perry, R.C., Cecil. Chemical engineers handbook. Advisory Board: New York, 1975.