Mokken Scale Analysis Alternative names: Unidimensional Latent - - PowerPoint PPT Presentation

mokken scale analysis
SMART_READER_LITE
LIVE PREVIEW

Mokken Scale Analysis Alternative names: Unidimensional Latent - - PowerPoint PPT Presentation

Monotone Homogeneity Model (MHM) Notation: X 1 , ..., X j , ..., X J : item scores; : latent trait MHM (Mokken, 1971) : General IRT model for P( X j = x |) Mokken Scale Analysis Alternative names: Unidimensional Latent Variable Model


slide-1
SLIDE 1

Mokken Scale Analysis

in MSP, in R, in SPSS

  • L. Andries van der Ark

Tilburg School of Social and Behavioral Sciences

a.vdark@tilburguniversity.edu

Monotone Homogeneity Model (MHM)

  • Notation: X1, ..., Xj, ..., XJ : item scores; θ: latent trait
  • MHM (Mokken, 1971): General IRT model for P(Xj = x|θ)

Alternative names: Unidimensional Latent Variable Model (e.g., Holland & Rosenbaum, 1991) Nonparametric Graded Response Model (e.g., Hemker et al., 1997),

Assumptions:

  • 5

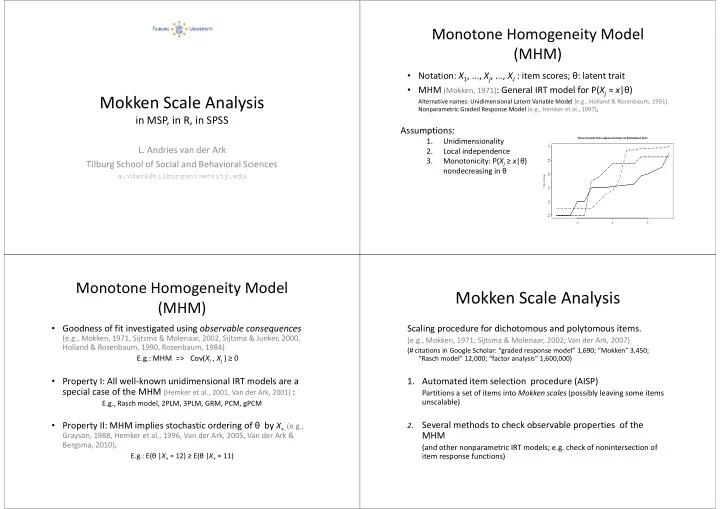
5 0.0 0 .2 0 .4 0 .6 0 .8 1.0 P (X =1|th eta) Three monotone item response functions for dichotomous items

Assumptions:

1. Unidimensionality 2. Local independence 3. Monotonicity: P(Xj ≥ x|θ) nondecreasing in θ

Monotone Homogeneity Model (MHM)

  • Goodness of fit investigated using observable consequences

(e.g., Mokken, 1971, Sijtsma & Molenaar, 2002, Sijtsma & Junker, 2000, Holland & Rosenbaum, 1990, Rosenbaum, 1984) E.g.: MHM => Cov(Xi , Xj ) ≥ 0

  • Property I: All well-known unidimensional IRT models are a
  • Property I: All well-known unidimensional IRT models are a

special case of the MHM (Hemker et al., 2001, Van der Ark, 2001) :

E.g., Rasch model, 2PLM, 3PLM, GRM, PCM, gPCM

  • Property II: MHM implies stochastic ordering of θ by X+. (e.g.,

Grayson, 1988, Hemker et al., 1996, Van der Ark, 2005, Van der Ark & Bergsma, 2010).

E.g.: E(θ |X+ = 12) ≥ E(θ |X+ = 11)

Mokken Scale Analysis

Scaling procedure for dichotomous and polytomous items.

(e.g., Mokken, 1971; Sijtsma & Molenaar, 2002; Van der Ark, 2007)

(# citations in Google Scholar: “graded response model” 1,690; “Mokken” 3,450; “Rasch model” 12,000; “factor analysis” 1,600,000)

  • 1. Automated item selection procedure (AISP)
  • 1. Automated item selection procedure (AISP)

Partitions a set of items into Mokken scales (possibly leaving some items unscalable) 2.

Several methods to check observable properties of the MHM

(and other nonparametric IRT models; e.g. check of nonintersection of item response functions)

slide-2
SLIDE 2

Mokken Scale Analysis in MSP

  • Mokken Scaling for polytomous items (MSP, Molenaar & Sijtsma,

2000) – User-friendly!! – Commercial package (€225 one-user licence) – DOS program with Windows shell (apparently fails under Windows 7) – Difficult to add new features

Mokken Scale Analysis in R

  • R package mokken (Van der Ark, 2007, 2010)

– Not so user-friendly because typical users of Mokken scale analysis do not use R. – Freeware – Easy to add new features library(mokken) data(acl) communality <- acl[,1:10] communality[1:3,]

reliable honest unscrupulous* deceitful* unintelligent* obnoxious* thankless* unfriendly* dependable cruel* [1,] 3 3 2 4 4 4 4 4 3 4 [2,] 2 4 4 3 3 4 1 3 4 4 [3,] 2 3 3 3 3 3 4 3 3 4

Mokken Scale Analysis in R Automated Item Selection Procedure

scale <- aisp(communality, search = "normal") scale reliable 1 honest 1 honest 1 unscrupulous* 0 deceitful* 1 unintelligent* 0

  • bnoxious* 2

thankless* 2 unfriendly* 2 dependable 1 cruel* 2

Mokken Scale Analysis in R Scalability Coefficients

H1 <- coefH(communality[,scale==1]) names(H1) round(H1$Hij,2) reliable honest deceitful* dependable reliable 1.00 0.53 0.33 0.72 honest 0.53 1.00 0.28 0.55 honest 0.53 1.00 0.28 0.55 deceitful* 0.33 0.28 1.00 0.32 dependable 0.72 0.55 0.32 1.00 round(H1$Hi,2) reliable honest deceitful* dependable 0.50 0.43 0.31 0.50 round(H1$H,2) 0.43

slide-3
SLIDE 3

Mokken Scale Analysis in R Check of model assumptions e.a.

check.monotonicity check.iio check.restscore check.reliability check.pmatrix S3 –methods available for summary() and plot(). Example > M1 <- check.monotonicity(communality[,scale==1]) > summary(M1) > plot(M1) > check.reliability(communality[,scale==1],LCRC=TRUE)

Mokken Scale Analysis in R New features

  • Automated item selection procedure using genetic algorithm

(Straat et al., 2010)

  • Investigating invariant item orderings (popular in clinical

nursing) (Ligtvoet et al., 2010, 2011)

  • New reliability coefficients (Van der Ark et al., 2011)
  • New reliability coefficients (Van der Ark et al., 2011)
  • Standard errors for scalability coefficients (future) (Van der

Ark et al., 2008; Kuijpers et al., 2011) Having software available increases the chance of publication

Mokken Scale Analysis in SPSS (i.e. use R code in SPSS)

BEGIN PROGRAM R. casedata <- spssdata.GetDataFromSPSS(variables =c("v_21, v_20, v_23, v_25, v_19, v_24, v_22")) library("mokken") print( “Scalability Coefficients" ) coefH(casedata) coefH(casedata) print( "Monoticity in Mokken Scale Analysis" ) MonoScale <- summary(check.monotonicity(casedata)) print(MonoScale) spsspivottable.Display(MonoScale, title="Results Monotonicity", format=formatSpec.GeneralStat) END PROGRAM R.

Mokken Scale Analysis in SPSS (i.e. use R code in SPSS)

  • Even better?: R code in the SPSS pull-down menu
  • Frustrating

– Difficult programming – Requires huge add-on files – Requires huge add-on files – Requires close inspection of computers (access rights)

  • But,

– Improving (SPSS 18) – Much larger audience

slide-4
SLIDE 4

References

1. Grayson DA (1988). “Two-Group Classification in Latent Trait Theory: Scores With Monotone Likelihood Ratio.” Psychometrika, 53, 383–392. 2. Hemker BT, Sijtsma K, Molenaar IW, Junker BW (1997). “Stochastic Ordering Using the Latent Trait and the Sum Score in Polytomous IRT Models.” Psychometrika, 62, 331–347. 3. Hemker BT, Sijtsma K, Molenaar IW, Junker BW (1996). “Polytomous IRT Models and Monotone Likelihood Ratio of the Total Score.” Psychometrika, 61, 679–693. 4. Hemker, B. T., Van der Ark, L. A., & Sijtsma, K. (2001). On measurement properties of continuation ratio

  • models. Psychometrika, 66, 487-506.

5. Holland, P. W., & Rosenbaum, P. R. (1986). Conditional association and unidimensionality in monotone latent variable models. The Annals of Statistics, 14, 1523-1543. latent variable models. The Annals of Statistics, 14, 1523-1543. 6. Kuipers, R. E., Van der Ark, L. A., & Croon, M. A. (2011). Testing Cronbach’s alpha using Feldt’s approach and a new marginal modeling approach. 7. Ligtvoet, R., Van der Ark, L. A., Bergsma, W. P., & Sijtsma, K. (2011). Polytomous latent scales for the investigation of the ordering of items. Psychometrika. 8. Ligtvoet, R., Van der Ark, L. A., Te Marvelde, J. M., & Sijtsma, K. (2010). Investigating an invariant item

  • rdering for polytomously scored items. Educational and Psychological Measurement, 70, 578-595.

9. Mokken RJ (1971). A Theory and Procedure of Scale Analysis. De Gruyter, Berlin, Germany.

  • 10. Molenaar IW, Sijtsma K (2000). User’s Manual MSP5 for Windows. Groningen: IEC ProGAMMA.
  • 11. Rosenbaum, P. R. (1984). Testing conditional independence and monotonicity assumptions of item

response theory, Psychometrika, 49, 425-435,

  • 12. Sijtsma K, Molenaar IW (2002). Introduction to Nonparametric Item Response Theory. Sage, Thousand

Oaks, CA.

  • 13. Straat, J. H., Van der Ark, L. A., & Sijtsma, K. (2011). Comparing optimization algorithms for item

selection in Mokken scale analysis. Paper submitted for publication.

References

  • 15. Van der Ark, L. A. (2005). Stochastic ordering of the latent trait by the sum score under various

polytomous IRT models. Psychometrika, 70, 283-304.

  • 16. Van der Ark, L. A. (2007). Mokken scale analysis in R. Journal of Statistical Software, 20 (11), 1-19.
  • 17. Van der Ark, L. A. (2010). Getting started with Mokken scale analysis in R. Unpublished manuscript.

Retrieved from http://cran.r-project.org/web/packages/mokken

  • 18. Van der Ark, L. A. & Bergsma, W. P. (2010). A note on stochastic ordering of the latent trait using the sum
  • f polytomous item scores. Psychometrika, 75, 272-279.
  • 19. Van der Ark, L. A., Croon, M. A., & Sijtsma, K. (2008). Mokken scale analysis for dichotomous items using
  • 19. Van der Ark, L. A., Croon, M. A., & Sijtsma, K. (2008). Mokken scale analysis for dichotomous items using

marginal models. Psychometrika, 73, 183-208.

  • 20. Van der Ark, L. A., Van der Palm, D. W., & Sijtsma, K. (2011). A latent class approach to estimating test-

score reliability. Applied Psychological Measurement.