
SLIDE 1
www.biorobotics.ttu.ee
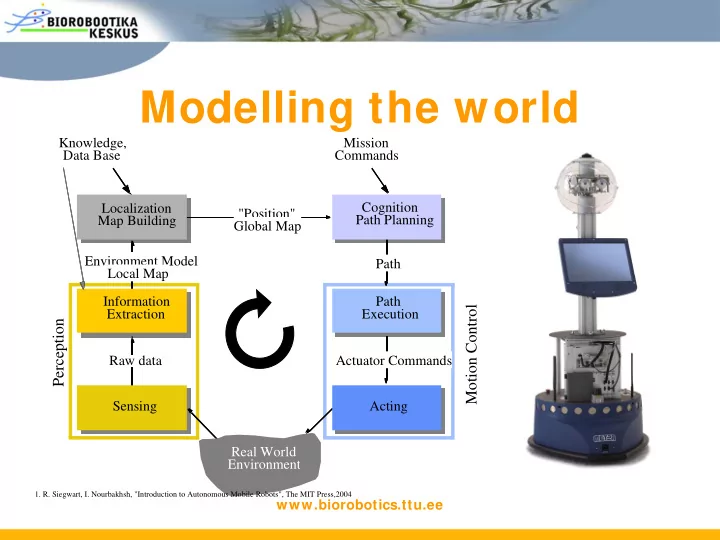
Modelling the world
Raw data Environment Model Local Map "Position" Global Map Actuator Commands Sensing Acting Information Extraction Path Execution Cognition Path Planning Knowledge, Data Base Mission Commands Path Real World Environment Localization Map Building
Motion Control Perception
- 1. R. Siegwart, I. Nourbakhsh, "Introduction to Autonomous Mobile Robots", The MIT Press,2004