Modelling approach Doses to man and biota Bacteria DCF Mammal - - PowerPoint PPT Presentation

modelling approach
SMART_READER_LITE
LIVE PREVIEW

Modelling approach Doses to man and biota Bacteria DCF Mammal - - PowerPoint PPT Presentation

Modelling approach Doses to man and biota Bacteria DCF Mammal Seaweeds Fish Molluscs Crustacea CF M CF F CF S CF C Ice module Radioactive decay Surface water Advection Radionuclides can be present in three Advection Advection


slide-1
SLIDE 1

Modelling approach

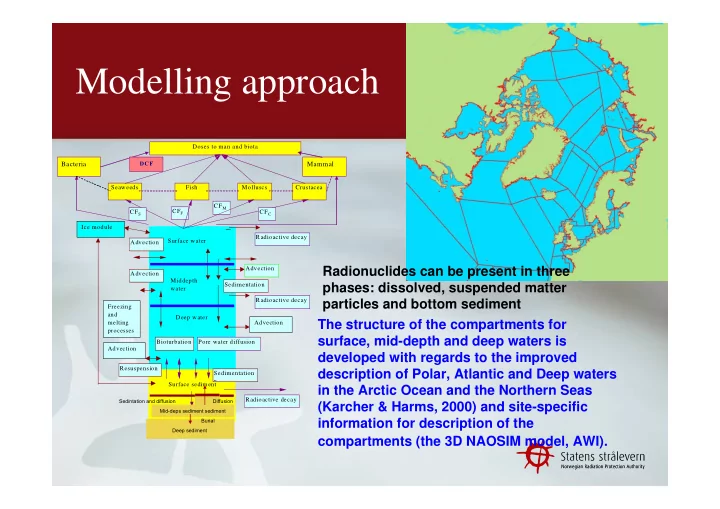
Surface water Deep water Surface sediment Deep sediment Advection Advection Advection Sedimentation n Sedimentation Resuspension Bioturbation Pore water diffusion Burial Radioactive decay Radioactive decay Radioactive decay Seaweeds Fish Molluscs Crustacea CFS CFF CFM CFC Doses to man and biota Ice module Freezing and melting processes Middepth water Advection Advection

Bacteria Mammal

DCF

The structure of the compartments for surface, mid-depth and deep waters is developed with regards to the improved description of Polar, Atlantic and Deep waters in the Arctic Ocean and the Northern Seas (Karcher & Harms, 2000) and site-specific information for description of the compartments (the 3D NAOSIM model, AWI).

Mid-deps sediment sediment Deep sediment Sedintation and diffusion Diffusion Burial

Radionuclides can be present in three phases: dissolved, suspended matter particles and bottom sediment

slide-2
SLIDE 2

The radiological sensitivity index SI(M) (Iosjpe et al., 2003): where ∆D is a variation in the collective dose to man during time ∆ T and S is the surface area of the relevant marine region.

T S D SI

) M (

∆ ∆ =

slide-3
SLIDE 3

Sensitivity of coastal waters

Cs-137 deposition (1y & 50y) Pu-239 deposition (1y & 100y) Doses to man after uniform atmospheric fallout 1 kBq/m2

slide-4
SLIDE 4

Years

0,1 1 10 100

Doses to Polychaete worm, µGy/h

0,1 1 10 100 1000 Am-241 Ce-144 Cm-242 Cm-244 Pu-238 Total

Doses to the Polychaete Worm

slide-5
SLIDE 5

S(L) and S(G)

) ( ) ( ) (

D P dP dD S L =

max min ) (

1 D D S G − =

Sensitivity indexes for local and global sensitivity analysis for model parameters, correspondingly (Jørgensen, 1994; Till and Meyer, 1983).

slide-6
SLIDE 6

Years

0,1 1 10

S(L)(RW)

  • 2,0
  • 1,5
  • 1,0
  • 0,5

0,0 0,5 1,0 1,5 Am-241 Cm-244 Pu-238 Cs-137

Years

0,1 1 10

S(L)(kd)

  • 0,6
  • 0,4
  • 0,2

0,0 0,2 0,4 0,6 0,8 1,0 Pu-238, water Pu-238, sediment

Years

0,1 1 10

S(L)(SSL)

  • 1,0
  • 0,5

0,0 0,5 1,0 1,5 Am-241, water Am-241, sediment

Years

1 2 3 4 5

238Pu concentration in water and sediment

1e-5 1e-4 1e-3 1e-2 1e-1 1e+0 1e+1 (A) surface water (B) surface water (A) bottom water (B) bottom water (A) surface sediment (B) surface sediment