
SLIDE 1
1
Military Service is a Vulnerable Occupation: Lung Disease as a Paradigm
Michael J. Falvo, PhD
Research Physiologist, VA War Related Illness & Injury Study Center – Airborne Hazards and Burn Pits Center of Excellence Assistant Professor, Rutgers New Jersey Medical School
Disclosure
- I have nothing to disclose
- Contents of this presentation do not represent
the views of the U.S. Department of Veterans Affairs or the United States Government
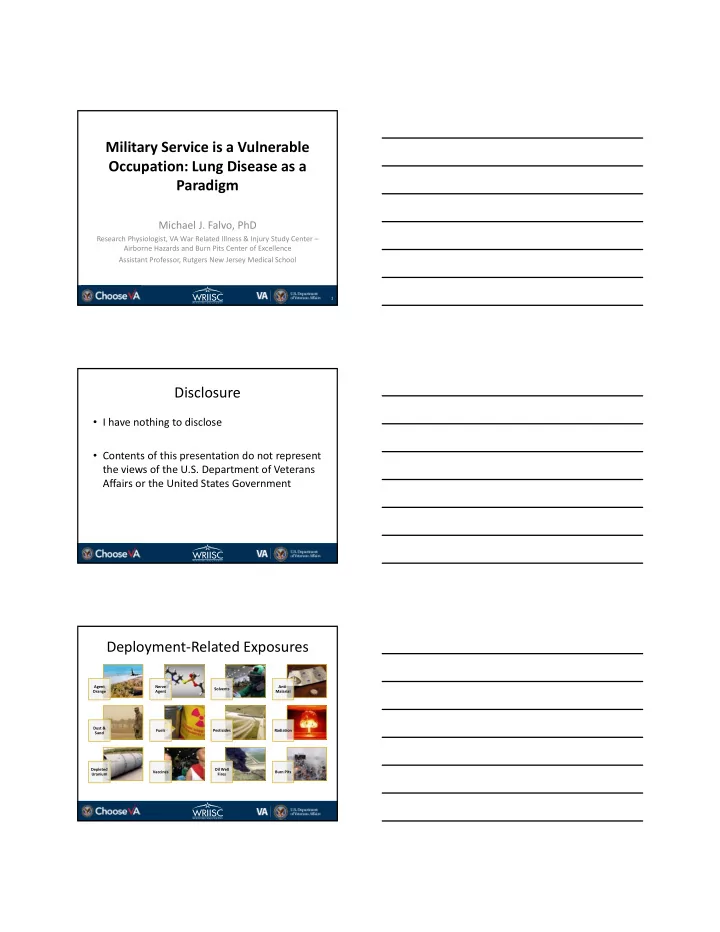
Deployment‐Related Exposures
Agent Orange Nerve Agent Solvents Anti‐ Malarial Dust & Sand Fuels Pesticides Radiation Depleted Uranium Vaccines Oil Well Fires Burn Pits