SLIDE 3 A Closer Look at Mg-Al Alloys: AZ31B
3
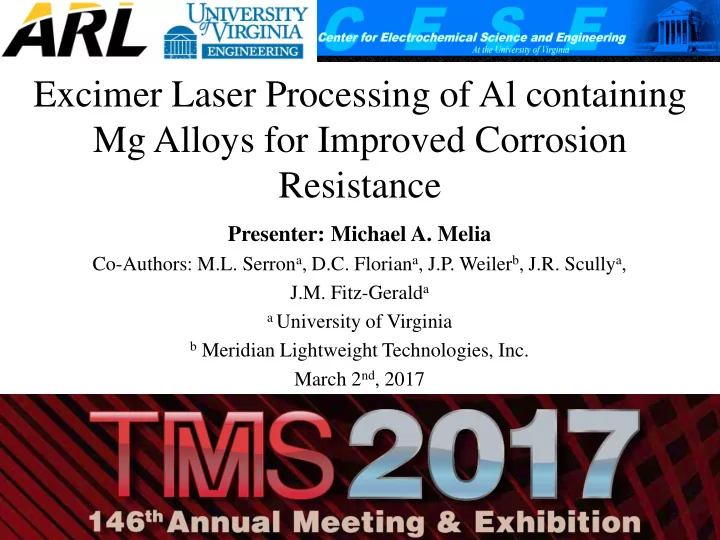
1 μm
Φ-Mg6(Al,Zn)5
γ-Al8Mn5 IMPs
10 μm
Large γ-Al8Mn5 IMPs
Mg has low solid solubility with alloying elements.
- K. Schlüter et al. / Corrosion Science 52 (2010) 3973–3977
- F. H. Froes et al. / Materials Science and Engineering, A 117 (1989) 19 – 32
http://www.himikatus.ru/art/phase-diagr1/Al-Mg.php
Binary System Equilibrium Terminal Solid Solubility Range (at. %) <0.1 0.1-1 1-5 5-25 >25 Mg - X As, Ba, Ce, Co, Cu, Eu, Fe, Ge, La, Na, Ni, Pd, Pr, Sb, Si, Sr Au, Ca, Ir, Nd, Th, Mn, Ti Ag, Bi, Dy, Ga, Gd, Hg, Pu, Sn, Y, Yb, Zn, Zr Al, Er, Ho, Li, Lu, Pb, Tl, Tm, In, Sc Cd