
SLIDE 1
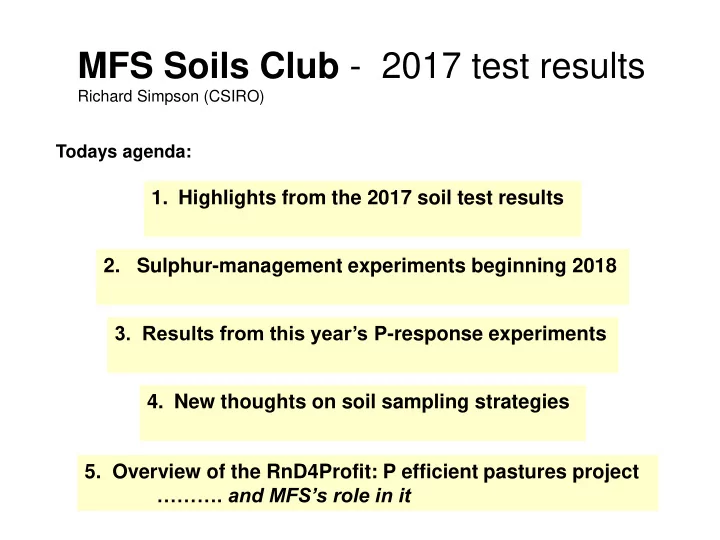
- 1. Highlights from the 2017 soil test results
- 3. Results from this year’s P-response experiments
- 2. Sulphur-management experiments beginning 2018
- 5. Overview of the RnD4Profit: P efficient pastures project
………. and MFS’s role in it
MFS Soils Club - 2017 test results
Richard Simpson (CSIRO)
- 4. New thoughts on soil sampling strategies
Todays agenda: