Methods of regularization and their justifications A uthors : W. R - - PDF document

methods of regularization and their justifications
SMART_READER_LITE
LIVE PREVIEW

Methods of regularization and their justifications A uthors : W. R - - PDF document

CS 109A: A dvanced T opics in D ata S cience P rotopapas , R ader Methods of regularization and their justifications A uthors : W. R yan L ee C ontributors : C. F osco , P. P rotopapas We turn to the question of both understanding and justifying


slide-1
SLIDE 1

CS 109A: Advanced Topics in Data Science Protopapas, Rader

Methods of regularization and their justifications

Authors: W. Ryan Lee Contributors: C. Fosco, P. Protopapas

We turn to the question of both understanding and justifying various methods for regularizing statistical models. While many of these methods were introduced in the context of linear models, they are now effectively used in a wide range of contexts beyond simple linear modeling, and serve as a cornerstone for doing inference or learning in high-dimensional contexts.

1 Motivation for regularization

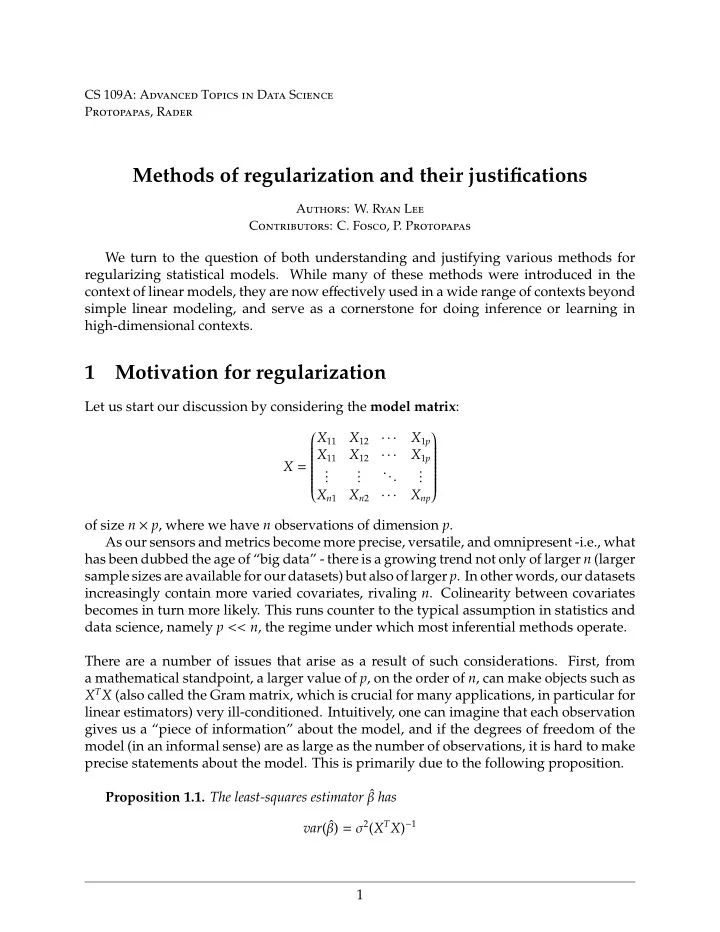
Let us start our discussion by considering the model matrix: X =               X11 X12 · · · X1p X11 X12 · · · X1p . . . . . . ... . . . Xn1 Xn2 · · · Xnp              

  • f size n × p, where we have n observations of dimension p.

As our sensors and metrics become more precise, versatile, and omnipresent -i.e., what has been dubbed the age of “big data” - there is a growing trend not only of larger n (larger sample sizes are available for our datasets) but also of larger p. In other words, our datasets increasingly contain more varied covariates, rivaling n. Colinearity between covariates becomes in turn more likely. This runs counter to the typical assumption in statistics and data science, namely p << n, the regime under which most inferential methods operate. There are a number of issues that arise as a result of such considerations. First, from a mathematical standpoint, a larger value of p, on the order of n, can make objects such as XTX (also called the Gram matrix, which is crucial for many applications, in particular for linear estimators) very ill-conditioned. Intuitively, one can imagine that each observation gives us a “piece of information” about the model, and if the degrees of freedom of the model (in an informal sense) are as large as the number of observations, it is hard to make precise statements about the model. This is primarily due to the following proposition. Proposition 1.1. The least-squares estimator ˆ β has var( ˆ β) = σ2(XTX)−1 1

slide-2
SLIDE 2
  • Proof. Note that the least-squares estimator is given by

ˆ β = (XTX)−1XTY Thus, the variance can be computed as var( ˆ β) = (XTX)−1XTvar(Y)

  • (XTX)−1XTT

= (XTX)−1XT X

  • (XTX)−1T var(Y)

= (XTX)−1XT X

  • (XTX)T−1 var(Y)

= (XTX)−1(XT X)(XTX)−1 var(Y) = σ2(XTX)−1 (1) as desired, noting that var(Y) = σ2I. Thus, an unstable (XTX)−1 implies the instability of the variance of our estimator. (XTX)−1 becomes unstable when we have multicollinearity (two or more of our predictors are colinear). If we get to that case, the following equivalent statements are true:

  • One or more eigenvalues of XTX are close to zero.
  • XTX is nearly singular.
  • The condition number κ of XTX is large. (remember that κ(XTX) = λmax

λmin )

We thus have an ill-behaved problem. the eigenvalue decomposition shows that the eigenvalues of (XTX)−1 can be extremely large, which will increase the variance of the estimators dramatically. Furthermore, numerically inverting a nearly singular matrix is numerically unstable, which adds to the general instability of our coefficients. When a problem is ill-behaved, small changes in the input generate large changes in the output. In our case, small changes in our data can yield large changes for the variability of the estimator, which is problematic. This statement can be corroborated by the following proposition (related to the per- turbation theorem). Proposition 1.2 Consider the following least-squares problem: minβ(X + δX)β − (Y − δY) If ˜ β is the solution of the original least squares problem, we can prove that: β − ˜ β β ≤

  • κ(XTX)δX

X 2

slide-3
SLIDE 3

In other words, a small κ(XTX) (or, equivalently, a large minimum eigenvalue) tightens the bound on how much the coefficients under a perturbation on the data. It is clear then that a large condition number (which, again, arises under multicollinearity) generates instability on the regression coefficients. Regularization attempts to mitigate this problem. Second, from scientist’s point of view, it is an extremely unsatisfying situation for a statistical analysis to yield a conclusion such as Y = α1X1 + α2X2 + · · · + α5000X5000 Regardless of how complicated the system or experiment may be, it is impossible for the human mind to be able to interpret the effect of thousands of predictors. Indeed, psychologists have found that human beings can typically only hold seven items in memory at once (though later studies argue for even fewer). Consequently, it is desirable to be able to derive a smaller model despite the existence of many predictors - a task that is related to regularization but is known as variable selection. In general, model parsimony is a goal often sought after, as it helps shed light on the relationship between the predictors and response variables. Third, from a data scientist’s viewpoint, it is troubling to have as many predictors as there are observations, which is related to the mathematical problem named above. For example, suppose that n = p, and we are considering a linear model Y = Xβ + ǫ Then, if X is full-rank, we can simply invert the matrix to obtain β = X−1Y , which will yield perfect results on the linear regression task. However, the model has learned nothing, so has dramatically failed at the implicit task at hand. This can be seen by the fact that such a model, which is said to be overfit, will typically have no generalization properties; that is, on unseen data, it will generally perform very poorly. This is evidently an undesirable scenario. Thus, we are drawn to methods of regularization, which combat such tendencies by constraining the space of possible β coefficients (usually by limiting their magnitude). This prevents the scenario from the above paragraph; if we constrain β sufficiently, it will not be able to take the perfect precision value β = X−1Y, and thus will (hopefully) be led to a value in which learning happens.

2 Deriving the Ridge Estimator

The ridge estimator was proposed as an ad hoc fix to the above instability issues by Hoerl and Kennard (1970) 1. From this point onward, we will generally assume that the model matrix is standardized, with column means set to zero and sample variances set to one. One of the signs that the matrix (XTX)−1 may be unstable (or super-collinear) is if the eigenvalues of the XTX are close to zero. This is because by the spectral decomposition, XTX = QΛQ−1

1Hoerl, A. E., and R. W. Kennard (1970). "Ridge Regression: Biased Estimation for Nonorthogonal

Problems." Technometrics 12 (1): 55-67.

3

slide-4
SLIDE 4

and so the inverse is (XTX)−1 = QΛ−1Q−1 where Λ−1 is simply the diagonal matrix of eigenvalues k−1

j for j = 1, . . . , p. Thus, if some

κj ≈ 0, then (XTX)−1 becomes very unstable (see a-section 1 for more details). The fix proposed by the ridge regression method is to simply replace XTX by XTX + λIp for λ > 0 and Ip being the p-dimensional identity matrix. This artificially inflates the eigenvalues of XTX by λ, making it less susceptible to the instability problem above. Note that the resulting estimator, which we will denote as ˆ βr, is defined by ˆ βR = (XTX + λIp)−1XTY = (Ip + λ(XTX)−1)−1 ˆ β (2.1) where the ˆ β on the right is the regular least-squares estimator. Example 2.2. To get some feel for how the ˆ βR behaves, let us consider the simple

  • ne-dimensional case; then

X = (x1, . . . , xn) is simply a column vector of observations. Let us suppose we have normalized the covariates, so that X2

2 = 1. Then the ridge estimator is

ˆ βR = ˆ β 1 + λ Thus, we can see how increasing values of λ shrink the least-squares estimate further and

  • further. Interestingly, we can also see that no matter what the value of λ is, ˆ

βR 0 as long as ˆ β 0. This explains why the ridge regression method does not perform variable selection; it does not make any coefficient go to zero, but rather shrinks them uniformly. After the fact, statisticians realized that this ad hoc method is equivalent to regularizing the least-squares problem using an L2 norm. That is, we can solve the ridge regression problem min

β∈Rp Y − Xβ2 2 + λβ2 2

(2.3) In other words, we want to minimize the least-squares problem as before (the first term) while also ensuring that the L2 norm of the coefficients β2 remains small as well. Thus, the optimization must tradeoff the least-squares minimization with the minimiza- tion of the L2 norm. Theorem 2.4. The solution of the ridge regression problem (Eq. 2.3) is precisely the ridge estima- tor (Eq. 2.1). 4

slide-5
SLIDE 5
  • Proof. As in the least-squares problem, we can write the above in matrix form as

(Y − Xβ)T(Y − Xβ) + λβTβ = YTY − 2YTXβ + βT(XTX)β + λβTβ Taking matrix derivatives, we find that the first-order condition is 2 (XTX)β − 2XTY + 2λβ = 0 ⇒ (XTX + λIp) ˆ βR = XTY which yields the desired estimator. Thus, we have arrived at the regularized regression problem in (Eq. 2.3) by considering an ad hoc method of inflating eigenvalues. From an optimization perspective, the problem in (Eq. 2.3) is also equivalent to the constrained optimization problem min

β2

2≤κ Y − Xβ2

2

(2.5) for some κ > 0. Thus, from this perspective, we are simply doing least-squares optimiza- tion, except under the constraint that the magnitude of the coefficients β2 be smaller than a maximum value κ that we are willing to allow. Of course, there is an inverse relationship between λ and κ; constraining smaller values of β2 (decreasing κ) is equivalent to more harshly regularizing the least-squares problem (increasing λ). Both the minimization and the penalization problem yield the exact same ˆ β when κ = ˆ β∗(λ), where ˆ β∗(λ) is the

  • ptimal estimator from the penalized problem with regularization factor λ.

Finally, it is interesting to note that there is always a value of λ for which the ridge regression problem (Eq. 2.3) yields an estimator (Eq. 2.1) that has strictly lower mean- squared error than the least-squares estimator, which we state here without proof. The proof is given in Hoerl and Kennard (1970). Theorem 2.6. There always exists λ > 0 such that E[ ˆ βR − β2

2] < E[ ˆ

β − β2

2]

That is, regardless of Y and X, there exists a value of λ for which the ridge regression estimator performs strictly better than the least-squares estimator in terms of mean-squared error. Note that this result and the following discussion concerns the mean-squared error in estimating the coefficients (that is, inference), not performance in terms of prediction. This theorem is interesting since the least-squares estimator is unbiased: E[ ˆ β − β] = 0 This can easily be derived, noting that E[ ˆ β] = (XTX)−1XTE[Y] = (XTX)−1XTXβ = β Recalling the linear model Y = Xβ + ǫ and assuming that ǫ has mean zero, which is generally the case. On the other hand, the ridge estimator is biased. Using (Eq. 2.1), we find that E[ ˆ βR] = (Ip + λ(XTX)−1)−1β β 5

slide-6
SLIDE 6

Thus, the fact that the mean-squared error of the ridge estimator is lower than that of the least-squares estimator implies that the variance of the ridge estimator must more than make up for the increase in bias. This is a tradeoff that is increasingly the case in statistics and machine learning; by relinquishing an unbiased estimator, we can try to obtain biased estimators that have sufficiently low variance to keep the mean-squared error low. This has become known as the bias-variance tradeoff in statistics and machine learning.

3 Deriving the LASSO Estimator

Allowing for biased estimators opens up a whole variety of different estimators and procedures for generating them. This also formally allows for the use of regularization techniques, which generally introduce some bias in the estimation, with the benefit of reducing variance. An obvious relative to ridge regression is to replace the L2 norm by the L1 norm as follows: min

β∈Rp Y − Xβ2 2 + λβ1

where β1 = p

j=1 |βj| is the L1 norm of the coefficients 1. Again, from an optimization

view, this is equivalent to the constrained optimization problem, min

β1≤κ Y − Xβ2 2

Indeed, this latter formulation was how the LASSO estimator was first proposed in Tib- shirani (1996)2. Example 3.1. Let us again consider a simpler example to gain some intuition about the properties of the LASSO estimator. A slightly more complex but similar example to the

  • ne-dimensional case above is when the model matrix is orthonormal; that is,

XTX = Ip In this case, we have that ˆ β = (XTX)−1XTY = XTY and we can derive the exact solution to the LASSO to be ˆ βL,j = sign( ˆ βj)[| ˆ βj| − λ]+ where [x]+ = x if x > 0 and is 0 otherwise, and ˆ βL denotes the LASSO estimator. In this case, the ridge estimator is ˆ βR,j = ˆ βj 1 + λ

2Note that the error in the estimation is still given in L2; that is, we still minimize the squared error.

Minimizing the absolute error (using the L1 norm for the error term as well) is known as least absolute deviation regression.

3Tibshirani, R. "Regression Shrinkage and Selection via the Lasso." JRSS B 58 (1): 267-288.

6

slide-7
SLIDE 7

as in the one-dimensional case.

  • Proof. For the ridge estimator, note that we have

ˆ βR = (Ip + λ(XTX)−1)−1 ˆ β = [(1 + λ)Ip]−1 ˆ β = (1 + λ)−1 ˆ β which yields the estimator above. For the LASSO estimator, we can again take the same matrix derivatives to find that the first-order condition is XTY = (XTX) ˆ βL + λ sign( ˆ βL) By multiplying both sides by (XTX)−1 = Ip, we find that ˆ β = ˆ βL + λ sign( ˆ βL) which, in terms of the components, are the equations ˆ βL,j = ˆ βj − λ sign( ˆ βL,j) Now we solve this by considering the sign of ˆ βL,j. If it is positive, then we have ˆ βL,j = ˆ βj − λ > 0; if it is negative, we have ˆ βL,j = ˆ βj + λ < 0. In either case, we must have that the sign of ˆ βj must be the same as the sign of ˆ βL,j, since λ > 0. Moreover, we can express x = |x| sign(x) . Thus, we have ˆ βL,j = ˆ βj − λ sign( ˆ βj) = sign( ˆ βj)[| ˆ βj| − λ]+ as desired. Note that the form of the estimators reveals much about their properties. As we discussed above, the ridge estimator components ˆ βR,j are shrunk versions of ˆ βj, but are strictly nonzero. On the other hand, the LASSO estimator components can very much be zero, if ˆ βj ≤ λ. That is, if we choose λ large enough such that certain components of the least-squares estimator ˆ β are smaller than λ, then we will be setting those components to zero (in the case of an orthonormal model matrix).

4 Geometry of Estimators and Their Properties

Note that the above example was given in the case of an orthonormal model matrix, for which XTX = Ip. This begs the question of whether the properties discussed above hold in more general settings. In particular, we noted that such regularization techniques are

  • ften desirable in the case of unstable XTX, where the eigenvalues become nearly zero.

This is clearly a large departure from the unit matrix situation when X is orthonormal. The above properties do in fact hold in general. Namely, the ridge estimator shrinks but does not generally zero out any of the coefficients, whereas the LASSO estimator does for appropriate values of λ, the regularization parameter. One intuition follows from Figure 1. The figure considers a two-dimensional case (p = 2), in which each of the axes 7

slide-8
SLIDE 8

Figure 1: A comparison of the estimators from LASSO (left) and ridge (right) regression. 2D representation of the loss surface stemming from the residual sum of squares and the constraints. represent β1, β2; that is, the plane represents the parameter space. The shaded portion depicts the part of the parameter space that satisfies the constraints β ≤ κ, for the norm being L1 or L2 respectively, known as the feasible region. The ellipses depict typical level curves of the error term Y − Xβ2

  • 2. The dot at the center of the ellipses represents the true

parameter β. Intuitively, note that the error is zero at β, and increases quadratically outward as ˆ β moves farther away from β. However, we are indifferent to where exactly on the level curve we are; the optimization cost (or error) is exactly the same at any point on the same level curve. Thus, our goal is to find the point that is within the shaded area (satisfying the norm constraint) that is on the level curve with the smallest error. It should be clear from the geometry that this will happen at the point where one of the level curves is precisely tangent to the edge of the feasible region. In the case of LASSO, this tends to occur at one of the axes, as shown in the figure (though it is possible that it does not). This implies that some of the coefficients are zero; in the example shown in the figure, ˆ βL,1 = 0 whereas ˆ βL,2 = κ. On the other hand, the ridge regression estimates will generally happen within the quadrant of the true value (rather than on the axes). This explains why the coefficients of the ridge estimator are generally nonzero, though they may be small in magnitude. For example, we see that in the figure, ˆ βR,1 is quite small relative to ˆ βR,2, but not strictly zero. The behavior of Ridge and LASSO coefficients as λ increases is portrayed in Figure 2. 8

slide-9
SLIDE 9

Figure 2: Evolution of the coefficients of a 5 dimensional random regression problem as the regularization factor lambda (here alpha) increases. As can be seen, Ridge does not truly nullify the parameters, while LASSO decreases them linearly until they are set to zero.

5 BayesianInterpretations ofRidgeRegression and LASSO

In addition to the regularization and constrained optimization perspectives, it turns out that both ridge and LASSO regression have a very natural interpretation from a Bayesian

  • viewpoint. While we emphasize that the estimators were not derived in this manner
  • riginally, the Bayesian interpretation, developed later, provides good intuition for the

two regularization methods. Recall that the linear regression problem models the responses Y as a function of the model matrix X via the linear predictor Xβ, with noise ǫ. Typically, we assume Normal errors, namely ǫ ∼ N(0, σ2In) . That is, each error term is independently distributed according to a Normal distribution. Thus, instead of the typical Y = Xβ + ǫ formulation, we can instead view this as putting a distribution on Y as Y|β ∼ N(Xβ, σ2In) (5.1) That is, if we knew the parameters or coefficients β, then the distribution of Y is Normal with the linear predictor Xβ as the mean.4 From a Bayesian perspective, it is natural to consider distributions over β, both before and after conditioning on the data. These are the prior and posterior distri- butions of β,

  • respectively. The prior is generally left to the statistician’s discretion, and it turns out that

there are two priors for the coefficients that lead to the ridge and LASSO estimators as the maximum a posteriori (MAP) estimators. Theorem 5.2. Consider the linear regression model above (5.1), and the MAP estimator ˆ βM ≡ arg max

β

p(β|Y)

4In all regression contexts, we assume that the model matrix X is fixed and known, so we do not explicitly

condition on it.

9

slide-10
SLIDE 10

where p(β|Y) denotes the posterior distribution of β given the data Y . (a) If the prior is β ∼ N(0, σ2/λ) then ˆ βM = ˆ βR. (b) If the prior is β ∼ L(0, 2σ2/λ) where L(a, b) denotes the Laplace distribution with location a and scale b, then ˆ βM = ˆ βL.

  • Proof. We first note that by Bayes’ rule, we can write

p(β|Y) = p(Y|β)p(β) p(Y) ∝ p(Y|β)p(β) where p(Y) is the marginal distribution of Y, which does not involve β, and p(β) is the prior distribution. Thus, by the monotonicity of the logarithm, arg max

β

p(β|Y) = arg max

β

p(Y|β)p(β) = arg max

β [log p(Y|β) + log p(β)]

Since we are assuming the model in (Eq. 5.1), we have log p(Y|β) ∝ −(2σ2)−1Y − Xβ2

2

again dropping any constants that do not involve β. Multiplying the entire optimization problem by −1, we turn a maximization into a minimization, and obtain arg max

β

p(β|Y) = arg min

β

  • (2σ2)−1Y − Xβ2

2 − log p(β)

  • Thus, if β ∼ N(0, τ2) , then we have

arg min

β

  • (2σ2)−1Y − Xβ2

2 + (2τ2)−1β2 2

  • and setting τ2 = σ2/λ yields the result. Similarly, for β ∼ L(0, b) , we obtain

arg min

β

  • (2σ2)−1Y − Xβ2

2 + b−1β1

  • and again setting b = 2σ2/λ completes the proof.

Just as the consideration of biased estimators opened up the possibility of using var- ious regularization techniques, the Bayesian perspective also inspires a wide variety of regression models, some of which are not immediate from the regularization perspective. For example, while both of the Normal and Laplace distributions are symmetric about their means, this need not be the case. We can consider asymmetric Laplace (or other) 10

slide-11
SLIDE 11

distributions if we have prior evidence to suggest that, for example, β1 should be positive. In this case, we may want to have a small scale parameter for β1 < 0, but a larger one for β1 > 0. In general, while the Normal and Laplace distributions have found most common use for Bayesian linear regression, any other prior distribution can be used in principle, depending on the problem at hand. Moreover, the regularized regression models correspond only to the MAP estimators under the Normal or Laplace priors, as discussed above. As we will discuss later in the class, Bayesian analysis generally goes beyond simple point estimators, such as the MAP estimator, and instead involves computation and analysis of the entire pos- terior distri- bution of β. Thus, "regularizing" using a Bayesian prior yields more precise statements and information about the parameter of interest, compared with least-squares estimation using a regularized model. Defining the regularization parameter. There is another important advantage that comes from the Bayesian formulation: the ability to set the regularization parameter directly from the data, without doing cross-validation. If we consider a model in which

  • ur coefficients stem from a distribution parametrized by lambda, we can marginalize out

the coefficients to obtain a distribution of Y conditioned solely on lambda, Y|λ. We can then use the Maximum Likelihood Estimation technique to find the most likely regularization factor given our data. This method is generally called Empirical Bayes, and in the context

  • f regression, it is generally referred to as Evidence Procedure:

Consider the following model: p(Y|β) ∼ N(Xβ, σ2I) p(β) ∼ N(0, A−1) Where: A−1 = τ2I τ2 =

  • σ2

λ1 , σ2 λ2 , . . . , σ2 λp

  • The marginal likelihood can be computed as follows:

p(Y|τ2) = ∞

−∞

N(Y; Xβ, σ2I)N(β; 0, A−1)dβ = N(Y; 0, σ2I + XA−1XT) = (2π)−N/2|Cτ|−1/2 exp

  • −1

2YTC−1

τ Y

  • (2)

With Cτ = σ−2I + XA−1XT. We take into account that we’re dealing with a normal-normal model, which easily defines the first integral. Now, we want the value of τ2 that maximizes this likelihood. As this is equivalent to minimizing the negative log-likelihood, we have: 11

slide-12
SLIDE 12

τ2

EB = arg min τ

log |Cτ| + YTC−1

τ Y

This can be easily minimized with any gradient descent algorithm or similar, which will yield the optimal value of lambda given our data. Note that this lambda will not necessarily be the lambda found by cross-validation, as here we are maximizing a data likelihood instead of comparing scores over held-out validation sets. We can also easily obtain optimal coefficient parameters from here, and a formula is available in chapter 13, p. 464 of Murphy’s “Machine Learning – A Probabilistic Perspective”. One practical advantage of this procedure is that it can easily allow for different regularization factors per covariates. As can be seen, we never explicitly required the lambdas from Cτ to be equal. Setting this constrained gets us back to Ridge. We can, however, potentially infer different values for every coefficient and thus increase the effectiveness of our regularization.

6 Combining Ridge and LASSO: Elastic Net Regulariza- tion

Unfortunately, both of the L1 and L2 regularizations discussed above are not without problems.5 First, we have already discussed the main problem of ridge regression. Though it can effectively tradeoff bias with variance to yield an estimator with lower mean- squared error, it always keeps all of the predictors in the model, and thus never yields a parsimonious model. On the other hand, though the LASSO estimator does often yield a sparse represen- tation, it has a number of limitations. When p > n, which is the case we are interested in most when considering regularization methods, it has been shown that LASSO can

  • nly select at most n predictors. That is, given a sample size of n and a large number of

predictors p > n, LASSO will only yield up to n predictors with nonzero coefficients, even if there were more in the true model. In addition, both empirical evidence and theoretical analysis (Efron et al., 2004) show that when there are a number of highly-correlated predictors, then the LASSO estimator indifferently selects one among them and discards the rest. This can be highly problematic in practice; for example, if a group of clustered genes jointly predict for a disease but are correlated, it would be scientifically invalid to randomly select one of these genes and ignore the rest. As a result of these considerations, Zou and Hastie (2005) developed the elastic net estimator, which combines both the LASSO (L1) and ridge (L2) penalties. The elastic net problem can be formulated as min

β∈Rp Y − Xβ2 2 + λ1β1 + λ2β2 2

(6.1)

5Zou, H., and T. Hastie (2005). "Regularization and Variable Selection via the Elastic Net." JRSSB 67 (2):

301-320.

12

slide-13
SLIDE 13
  • r, equivalently, as

min

β∈Rp Y − Xβ2 2 + λ[αβ1 + (1 − α)β2 2]

where we define λ = λ1 + λ2 and α = λ1 λ1 + λ2 . Thus, elastic net evidently com- bines both the L1 and L2 penalties into one regularization term, which is a convex combination of the two. As in the case of ridge regression and LASSO, this is equivalent to a constrained

  • ptimization problem, which can be written as

min

αβ1+(l−α)β2

2≤t Y − Xβ2

2

(6.2) where α ∈ [0, 1] is a fixed hyperparameter. In particular, note that ridge regression and LASSO are special cases of the elastic net, with α = 0 or α = 1, respectively. What makes the elastic net both interesting and effective is that it combines not just the penalties, but also the benefits of each regularization method. The elastic net generally yields an estimator ˆ βE that is both sparse as in the LASSO estimator and shrunk as in the ridge estimator. This is made clear in the following theorem. Theorem 6.3. Let ˆ βE be the elastic net estimator that solves (6.1) for given Y and X, and hyperparameters λ1, λ2. Construct the augmented problem Y∗ ≡

  • Y
  • ∈ Rn+p

X∗ = (1 + λ2)−1/2

  • X

λ1/2

2 I

  • ∈ R(n+p)×p

and define γ ≡ λ1/(1 + λ2)1/2 and the augmented β∗ = (1 + λ2)1/2β. Then, the elastic net problem can be written as ˆ β∗ = arg min

β∗∈Rp Y∗ − X∗β∗2 2 + γβ∗1

(6.4) and the elastic net estimator satisfies ˆ βE = (1 + λ2)−1/2 ˆ β∗ (6.5)

  • Proof. Some matrix calculations can show that the problems are equivalent. Note that

Y∗ − X∗β∗2

2 = Y − Xβ2 2 + λ2β2 2

and similarly γβ∗1 = λ1β1. Thus, the problem is in fact identical to the elastic net problem in (Eq. 6.1). In other words, the theorem states that the elastic net problem can be reformulated as a LASSO problem on augmented data. This augmented formulation, while seemingly trivial, does provide a number of insights into the behavior and possibilities of the elastic 13

slide-14
SLIDE 14

net estimator. First, note that since the sample size of X∗ is n + p > p, the elastic net estimator can actually select all p predictors, unlike the LASSO estimator. On the other hand, the fact that ˆ βE is simply a shrunk version of ˆ β∗ indicates that the elastic net estimator does perform variable selection in the sense of LASSO, yielding a sparse representation. Thus, the elastic net estimator overcomes the primary difficulties faced by the LASSO and ridge estimators separately. 14