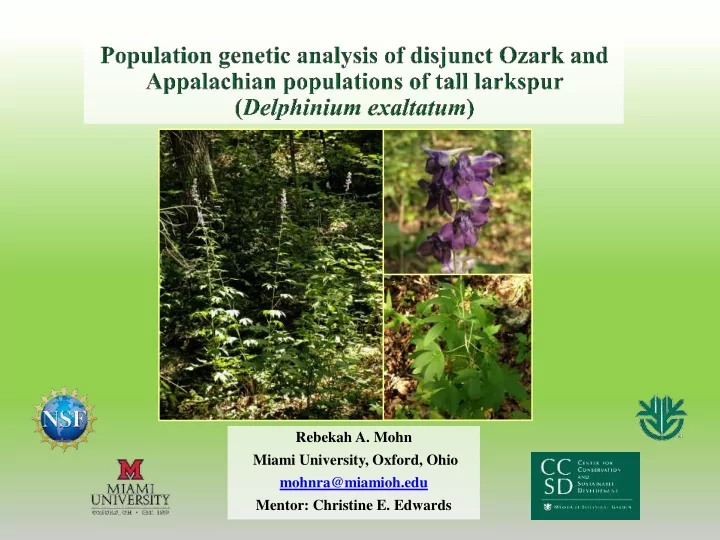
Mentor: Christine E. Edwards A separately evolving metapopulation - - PowerPoint PPT Presentation

mentor christine e edwards
SMART_READER_LITE
LIVE PREVIEW

Mentor: Christine E. Edwards A separately evolving metapopulation - - PowerPoint PPT Presentation

Rebekah A. Mohn Miami University, Oxford, Ohio mohnra@miamioh.edu Mentor: Christine E. Edwards A separately evolving metapopulation lineage where lineage refers to an ancestor -descendent lineage. (De Queiroz, 2007) De Queiroz.


slide-1
SLIDE 1

Rebekah A. Mohn Miami University, Oxford, Ohio mohnra@miamioh.edu Mentor: Christine E. Edwards

slide-2
SLIDE 2
  • “A separately evolving metapopulation lineage”

where lineage refers to an “ancestor-descendent lineage.” (De Queiroz, 2007)

De Queiroz. 2007. Systematic Biology

slide-3
SLIDE 3
  • The Appalachian and Ozark disjunction. (400 miles)
  • Causes of disjunction:
  • Long-distance dispersal
  • Glaciation
  • Recolonization from refugia
  • A hot and dry period following glacial retreat
  • Raven. 1972. Annals of Botany
  • D. exaltatum distribution from USDA Plants Database
slide-4
SLIDE 4

Delphinium exaltatum Aiton

  • Perennial herb with disjunct distribution.
  • Flowers insect pollinated and self-compatible.
  • Seeds are gravity or water dispersed.
  • Conservation status: vulnerable.
  • D. exaltatum distribution from USDA Plants Database
slide-5
SLIDE 5
  • How is genetic variation structured in Delphinium

exaltatum?

  • What biogeographical factors have affected patterns of

genetic structure?

  • Do patterns of genetic structure reflect the disjunction

between the two groups of Delphinium exaltatum?

  • Is there evidence that D. exaltatum may contain more

than one species?

slide-6
SLIDE 6
  • Null hypothesis: Genetic structure does not reflect

the disjunction between the two groups of Delphinium exaltatum.

  • Genetic structure reflects the disjunction between

the two groups of Delphinium exaltatum supporting distinction taxonomically of the two groups.

slide-7
SLIDE 7

Abbr. Voucher County, State na MO1

  • S. Farrington, et al. 12-16 (MO)

Howell, MO 22 MO2

  • E. Haglund, et al. OZAR 43809 (ONSR*)

Shannon, MO 24 MO3

  • E. Haglund, et al. OZAR 43810 (ONSR*)

Shannon, MO 24 MO4

  • G. Yatskievych, et al. 12-054 (MO)

Shannon, MO 17 MO5

  • G. Johnson, et al. s.n. (MO)

Shannon, MO 10 NC1

  • Y. Johnson s.n. (MO)

Watauga, NC 22 NC2

  • Y. Johnson s.n. (MO)

Durham, NC 22 PA1 S.P. Grund 6219 (MO) Huntington, PA 13 TN1

  • R. Cook s.n. (MO)

Anderson, TN 23 VA1

  • A. Hyduke, et al. 11 (MO)

Montgomery, VA 21 WV1

  • P. J. Harmon, et al. 3490 (MO)

Mecer, WV 23

slide-8
SLIDE 8

Microsatellite: Small base pair repeats in the nuclear DNA. Locus: A specific microsatellite (or other genetic fragment) that is usually isolated with a primer. Diploid: every individual has two alleles per locus. Allele: The number of base pairs at a microsatellite. Homozygote: an individual with two of the same allele. Heterozygote: an individual with two different alleles. PCR: Polymerase Chain Reaction.

slide-9
SLIDE 9

Sample collection DNA extraction

  • CTAB

DNA amplified

  • PCR
  • Yale analyzed

Data Scored

  • Microsatellites scored

Data Analysis

  • Structure
  • Clumpak
  • MSA
  • Genepop
  • BOTTLENECK
  • INEST
  • Arlequin
  • FSTAT
  • Genodive

Results

slide-10
SLIDE 10
slide-11
SLIDE 11

Genetic Divergence

slide-12
SLIDE 12

Genetic Divergence

Figure A: Distribution map with structure results. Figure B: K=2 through K=5 Structure results.

slide-13
SLIDE 13

Genetic Divergence

An unrooted tree calculated with Nei’s genetic distance

slide-14
SLIDE 14

Patterns of pairwise genetic structure in D. exaltatum. The genetic distance calculated by Jost’s D is reported above the diagonal (P67 was not included in the Jost’s D calculation)

Obs. MO1 MO2 MO3 MO4 MO5 NC1 NC2 PA1 TN1 VA1 WV1 MO1 MO2 MO3 MO4 MO5 NC1 NC2 PA1 TN1 VA1 WV1

Genetic Divergence

slide-15
SLIDE 15

Patterns of pairwise genetic structure in D. exaltatum. The genetic distance calculated by Jost’s D is reported above the diagonal (P67 was not included in the Jost’s D calculation)

Genetic Divergence

Obs. MO1 MO2 MO3 MO4 MO5 NC1 NC2 PA1 TN1 VA1 WV1 MO1 0.219 0.103 0.057 0.069 0.676 0.572 0.623 0.298 0.700 0.606 MO2 0.219 0.107 0.258 0.289 0.709 0.491 0.697 0.323 0.771 0.819 MO3 0.103 0.107 0.145 0.180 0.714 0.508 0.674 0.402 0.778 0.754 MO4 0.057 0.258 0.145 0.150 0.660 0.548 0.632 0.247 0.677 0.575 MO5 0.069 0.289 0.180 0.150 0.794 0.472 0.952 0.388 0.786 0.766 NC1 0.676 0.709 0.714 0.660 0.794 0.819 0.248 0.716 0.280 0.243 NC2 0.572 0.491 0.508 0.548 0.472 0.819 0.639 0.307 0.682 0.755 PA1 0.623 0.697 0.674 0.632 0.952 0.248 0.639 0.629 0.377 0.247 TN1 0.298 0.323 0.402 0.247 0.388 0.716 0.307 0.629 0.490 0.530 VA1 0.700 0.771 0.778 0.677 0.786 0.280 0.682 0.377 0.490 0.114 WV1 0.606 0.819 0.754 0.575 0.766 0.243 0.755 0.247 0.530 0.114

slide-16
SLIDE 16

Genetic Divergence

Percent of Variation {MO1, MO2, MO3, MO4, MO5} vs. {VA1, WV1, NC1, NC2, PA1, TN1} Among groups 20.06 Among populations within groups 32.28 Within populations 47.66 Percent of Variation {MO1, MO2, MO3, MO4, MO5, TN1, NC2} vs. {VA1, WV1, NC1, PA1} Among groups 40.15 Among populations within groups 17.7 Within populations 42.15

slide-17
SLIDE 17
slide-18
SLIDE 18
  • Genetic variation and structure is not according to the biogeographical boundaries and

taxonomic distinction based on the disjunction is not supported.

  • Divergence potentially to the level of speciation may have occurred between {PA1,

WV1, VA1, NC1} and {MO1, MO2, MO3, MO4, MO5, NC2, TN1}.

  • {NC2} has also diverged from {MO1, MO2, MO3, MO4, MO5, TN1}, possibly to the

point of distinction.

Genetic Divergence

slide-19
SLIDE 19
  • {MO1, MO2, MO3, MO4,

MO5}

  • Southern
  • Lower Elevations
  • Western
  • {PA1, WV1, VA1, NC1}
  • Northern
  • Higher Elevations
  • Eastern
  • {NC2, TN1}
  • Southern
  • Lower Elevations
  • Eastern
slide-20
SLIDE 20
  • {MO1, MO2, MO3,

MO4, MO5}

  • Western
  • {PA1, WV1, VA1, NC1,

TN1, NC2}

  • Eastern

East-West Disjunction

Long-Distance Dispersal Recolonization from coastal refugia Hot and dry climate

slide-21
SLIDE 21
  • {PA1, WV1, VA1, NC1}
  • Northern
  • Higher Elevations
  • {MO1, MO2, MO3,

MO4, MO5, NC2, TN1}

  • Southern
  • Lower Elevations

Genetic Divergence

Appalachian uplift Glaciation

slide-22
SLIDE 22
  • Genetic Divergence
  • The genetic structure does not reflect the

biogeographical distribution and does not support taxonomic separation of Missouri from the Appalachian populations of Delphinium exaltatum.

  • Speciation may have occurred between the

northern and southern populations.

  • Future Research
  • Determine whether morphometric analyses

support distinguishing the two groups as separate species.

  • Add an Ohio population to the genetic

analysis to further explain the biogeographic and genetic distributions of various groups.

slide-23
SLIDE 23
  • Special thanks to Joel Swift, Burgund Bassüner, Alex Linan,

George Yatskievych, Peter Hoch, David Bogler, Allison Miller, and the many other individuals who made this program possible. Thanks to NSF for funding and the Missouri Botanical Garden for hosting the REU.

  • Thank you to Chrstopher T. Frye, Maile Neel, Tanja

Schuster, Kerry Wixted, Donald Rohrback, Susan Farrington, Randall J. Evans, Grace Johnson, Dan Drees, Paul McKenzie, Liz Olson, Randy Evans, Erin Haglund, Yari Johnson, Steven Grund, Rebecca Cook, Abigail Hyduke, Tom Wieboldt, Paul J. Harmon, and Jeff Hajenga for collecting the vouchers and samples for DNA.

slide-24
SLIDE 24