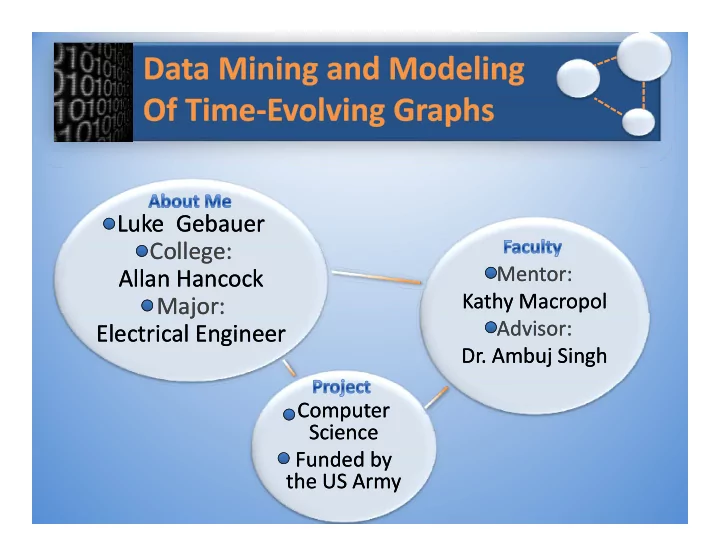
SLIDE 1 Luke Luke Gebauer Gebauer C ll C ll
Mentor: Mentor: Kathy Kathy Macropol Macropol
College: College: Allan Hancock Allan Hancock Major: Major:
Advisor: Advisor: Dr.
Ambuj Singh Singh
Major: Major: Electrical Engineer Electrical Engineer
Computer Computer Science Science F d d F d d b Funded Funded by by the the US Army US Army
SLIDE 2 Sales Sales
1st Qtr 2nd Qtr
Y Value 1
Q 3rd Qtr 4th Qtr 2 5 3 3.5
Y‐Value 1
1 1.5 2 2.5 5 6 0.5 1 1 2 3 2 3 4 Series 1 Series 2 Series 3 1
SLIDE 3 Wh k i i Wh k i i l i l i
Los Angeles Reno
Traffic Data Traffic Data
Time: 11:00am 5:00pm 2:00am
What makes it time What makes it time‐evolving evolving
San Francisco
Nodes Nodes
Los Angeles Santa Barbara
Traffic: 100 Vehicles p 900 Vehicles 50 Vehicles
Santa Barbara
Edges Edges
Angeles Barbara
HWY 101
Bakersfield Barbara Stockton Bakersfield
Data Mining Tasks Data Mining Tasks
SLIDE 4
Research Objectives Research Objectives Research Objectives Research Objectives Importance Importance Provide additional Construct a time Provide additional time evolving graphs for future data evolving graph of countries and their international trade P f l t i Predict the future mining algorithms international trade transactions Perform clustering algorithms on constructed graph socio‐economic statuses and international relations of countries
SLIDE 5 Clusters Edges Nodes Nodes Clustering Graph Algorithm Preprocessing
SLIDE 6 Large scale image of Large scale image of Large scale image of time‐evolving country graph Large scale image of time‐evolving country graph Enlarged image
- f time‐evolving
- f time evolving
country graph
SLIDE 7
Clustered Clustered
2693 2693 849 849
Clustered Clustered time time‐evolving evolving country graph country graph
2734 2734 1324 1324 7393 7393 2693 2693 3994 3994 3929 3929 5921 5921
country graph country graph
3294 3294 1246 1246 1193 1193 3929 3929 5921 5921 2734 2734 1293 1293 5394 5394 795 795 273 273 4203 4203 5394 5394
Enlarged image of Enlarged image of clustered graph clustered graph
SLIDE 8 Data is Data is
Pearson Correlation Coefficient
(between the average physical distance of the countries in the clusters, and the l )
‐0.2
(significance is anything that has an absolute value greater than ~0 07)
Data is Data is significant! significant!
average cluster score) absolute value greater than 0.07)
Conclusion Conclusion
Since the cluster score increases as the average distance between countries decreases, greater amounts of trading takes place between countries that are in p close proximity to one another
SLIDE 9
ddi i l h h if h h d i i ddi i l h h if h h d i i Additional hypotheses to verify through data mining Additional hypotheses to verify through data mining
h Do smaller countries tend to trade in close proximity? Do smaller countries tend to trade in close proximity? Based upon their current trade Based upon their current trade values, can a model be built to values, can a model be built to predict how clusters of countries will predict how clusters of countries will form in the future? form in the future? Do countries tend to Do countries tend to stay within their own stay within their own clusters? clusters? What other attributes of a country What other attributes of a country determine its trading values (i.e. determine its trading values (i.e. population, geographical placement, population, geographical placement, etc…)? etc…)?
SLIDE 10 Nodes Nodes
Data objects that we
Edges Edges
Some common factor Data objects that we want to know more information about Some common factor between the data objects that changes value over time
Predictive Tasks Predictive Tasks
Models that can predict future events within
Descriptive Tasks Descriptive Tasks
Deriving patterns that summarize the underlying future events within the graph based upon its attributes summarize the underlying relationships between the data objects
SLIDE 11
SLIDE 12 ¼ 1/3 ½ 1/3 ¼ 1/3 0 1/3 ¼ 0 ½ 0 ¼ 1/3 ½ 1/3 ¼ 1/3 0 1/3 ¼ 0 ½ 0
Build a probability Build a probability matrix and perform matrix and perform
Initial probability Initial probability matrices matrices ¼ 1/3 0 1/3 ¼ 1/3 0 1/3
random walks using random walks using “Markov Chains” until “Markov Chains” until the converged matrix is the converged matrix is
“ k h ” “ k h ”
g
“Markov Chains” Process “Markov Chains” Process Cluster structure Cluster structure 1 2 Will eventually equal Will eventually equal the converged matrix the converged matrix where possible cluster where possible cluster .50 .50 ‐‐ .50 ‐‐ ‐‐ ‐‐ ‐‐ ‐‐ ‐‐ 1 0 ‐‐ 3 4 p structures may be seen structures may be seen 1.0 .50 .50 ‐‐ .50
SLIDE 13 Genes Genes
Main Purpose Main Purpose Main Purpose Main Purpose
Predict an unknown Predict an unknown Predict an unknown Predict an unknown
Shared Gene Shared Gene Functions Functions
gene’s function by gene’s function by looking at what looking at what
- ther genes were
- ther genes were
gene’s function by gene’s function by looking at what looking at what
- ther genes were
- ther genes were
Functions Functions
- ther genes were
- ther genes were
clustered together clustered together with it based upon with it based upon k h d k h d
- ther genes were
- ther genes were
clustered together clustered together with it based upon with it based upon k h d k h d known shared known shared functions functions known shared known shared functions functions
SLIDE 14
Further Data Mining Further Data Mining Analysis Analysis Further Data Mining Further Data Mining Analysis Analysis Granger Causality Granger Causality Coefficient Coefficient Granger Causality Granger Causality Coefficient Coefficient y
Build predictive models for Build predictive models for graph based upon its attributes graph based upon its attributes Build predictive models for Build predictive models for graph based upon its attributes graph based upon its attributes Statistical method which Statistical method which h lik l it i h lik l it i Statistical method which Statistical method which h lik l it i h lik l it i graph based upon its attributes graph based upon its attributes graph based upon its attributes graph based upon its attributes Test to determine if there are Test to determine if there are Test to determine if there are Test to determine if there are measures how likely it is measures how likely it is that one property causes that one property causes another, across time another, across time measures how likely it is measures how likely it is that one property causes that one property causes another, across time another, across time any connections between any connections between properties of the countries properties of the countries within the clusters and how within the clusters and how any connections between any connections between properties of the countries properties of the countries within the clusters and how within the clusters and how Do changes in population Do changes in population drive changes in trade or drive changes in trade or Do changes in population Do changes in population drive changes in trade or drive changes in trade or those clusters form those clusters form those clusters form those clusters form drive changes in trade or drive changes in trade or cluster size? cluster size? drive changes in trade or drive changes in trade or cluster size? cluster size?