
SLIDE 1
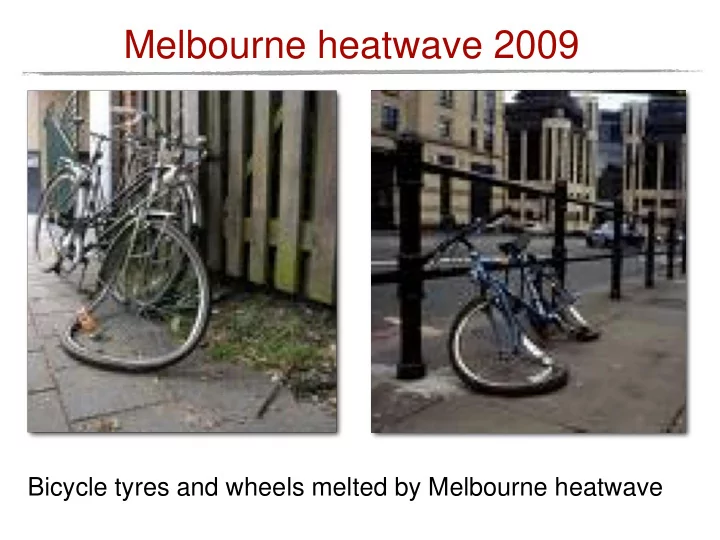
Bicycle tyres and wheels melted by Melbourne heatwave
Melbourne heatwave 2009 Bicycle tyres and wheels melted by Melbourne - - PowerPoint PPT Presentation
Melbourne heatwave 2009 Bicycle tyres and wheels melted by Melbourne heatwave How to cool cities by 2 degrees by 2020 Michael Mobbs, Sustainable Projects michael@sustainablehouse.com.au 0424 460 525 www.sustainablehouse.com.au, Or, cities
Bicycle tyres and wheels melted by Melbourne heatwave
Michael Mobbs, Sustainable Projects www.sustainablehouse.com.au, michael@sustainablehouse.com.au 0424 460 525
From forest to farm to black road, black roofs, little or no trees. City plans, road design, sustainability checklists and red tape ignore city heat, and make cities hotter.
In the 2002 European heat wave when 34,000 people died in four months London was 9 degrees hotter than the surrounding countryside
13 Governments have created red hot radiator roads heating
Road-makers, utilities in the streets, councils What the sun sees & does to cities:
degrees
degrees
No heat goals in city plans, road design guidelines, codes, green checklists + No responsibility, no incentives = hot cities.
Going up:
How? Plans, codes, checklists, road designs, employment performance contracts have common goal to cut city summer temperatures by 2 degrees by 2020 How? Cool materials, colours for roads, roofs, walls How? Grow trees, plants, pop up median strips, urban farms
grow trees, plants to cool our cities; no food waste to landfill. How? Financial, and red tape incentives. Benefits: Cool cities, lower energy, water and food bills; healthier humans and enriching, biodiverse cities.
Case Study: Myrtle St, Chippendale
www.streetcoolers.com.au streetcoolers@gmail.com
Cost to Council of trial $75k; less with volume Cooling Effect: Access to data here, or as CSV
Temp (‘C) Ave Temp in Sun Ave Temp in Shade Ave Difference Shade and Ambient DARK 46.4 25.0
LIGHT 45.7 22.8
DIFFERENC E
0.9
Shading and vegetation cools our streets more than pale roads We found that surface level temperatures in the shade were on average 9⁰C cooler than those in the sun. Buckland St has the darkest pavement, but the coolest ambient summer temperatures while Myrtle St had the highest. Why? Shading! Buckland had 64% tree cover compared with Myrtle St at just 6%.
Buckland St, Chippendale in Oct 2016
www.streetcoolers.com.au streetcoolers@gmail.com
Video taken in November 2016, on Albermarle St, Newtown. Ambient Temperature was only 22 degrees.
The difference? Over 18 degrees cooler in the shade
a street tree, when compared to direct sun
the road
www.streetcoolers.com.au streetcoolers@gmail.com
A six year old laying a leaky drainage pipe, Shepherd st, Chippendale, Dec 16. Not one consultant around.
charges me a stormwater fee; I refuse to pay it
charges me a stormwater levy; I refuse to pay it.
Watering street trees with rainwater using a leaky drain
Plant the verge
Enjoy the verge
A productive, cool fence
Coffee grounds at café guilia
Coffee grounds going
Two ways to cool your street Streetgardens and ecoPOPs
Business as usual Streetgardens ecoPOPs How it works Cooling streets Managing stormwater
Cities replace vegetation with dark, built surfaces which get very hot and do not absorb rainfall. This is the main cause of Urban Heat Islands. Grow trees, plant gardens and harvest rainwater on your street. Streetgardens and ecoPOPs bring vegetation, increased tree canopies and rainwater collection to an otherwise unshaded, hot, and wasteful street. 21.6 BILLION LITRES of stormwater pollute Sydney’s harbours every year because city roads and verges are impermeable. Streetgardens divert street runoff into a patch of soil on the curb to irrigate trees and plants. ecoPOPs can collect up to 2,000L of rainfall and use it to water the built-in gardens and trees.
Cutting energy use
Average air temperatures
people or more can be 1 to 3°C warmer than its rural surroundings. In the evening, the difference can be as high as 12°C. Research shows that a 10% increase in urban green space can cool surface temperatures by up to 4 C. Shade trees can reduce surface temperatures by up to 19°C. Streetgardens and ecoPOPs cool streets by increasing shade. Urban Heat Islands increase electricity demand, especially on summer afternoons when
running cooling systems, lights, and appliances. Studies show that every 1 C temperature reduction means around 5% energy savings through reduced cooling load. This amounts to significant savings in your fridge and aircon bills.
for farmers, city folk who go
deemed to comply approvals for low heat, low bills projects
$300 a year for a four person household
increase electricity grid efficiency, cut human and biodiversity mortality rates; data, examples
cities via incentives for building owners who invest on their land and adjacent street.
surface temperatures by up to 4 degrees C
up to 19 degrees C.
there is around 5% energy savings through reduced cooling loads. Fridge and aircon use and bills drop significantly.
A rate rebate to participating households of ~ $120 a year for so long as they maintain the trees, irrigation and put compost from food waste on them can be revenue neutral for councils, water and road agencies.
Drain gardens and pop up gardens can catch, store and absorb from 2,000 to 29,000 litres of water a year to grow trees, plants and canopy. Adding five to 20 trees + 5 to 20 leaky drains & stormwater bypasses to a treeless city block of about 40 houses at a one-off cost to property owners between a total of $500 to $15,000 will cut energy bills for air con and refrigeration at each house from between $150 to $2000 a year.
The average amplitude of UHIE in Australia will be 5 degrees, with a high penalty of 23% increase in energy user per degree (Santamouris, 2016) Additional 2.7 Billion people worldwide that require many additional resources (UN, 2015) 800% Increase in energy use worldwide, leaving many people in energy poverty (Santamouris, 2016) Statistically significant increase in number and duration of heat waves, resulting in an exponential increase in mortality rate above 37.7oC, especially children and elderly (Loughnan, 2010)
Monitoring of street temperatures, house energy use Eg www.solaranalytics.com, tree canopy and height
Tour Fact Sheet – Sydney’s Sustainable House and Chippendale Road Gardens
Sydney’s Sustainable House Chippendale Road Gardens Your project Books If four people live there, each year it saves:
energy and water bills
polluting Earth
Sydney Harbour
Over 1,000 fruit trees, herbs and plants both native and introduced are in Chippendale road gardens:
What will you choose for your project? Facts, examples, how to go green, drawings, photos:
Mobbs
Mobbs Books may be purchased on the tour Same as any other house to live in because:
house
energy and water because they are efficient
required
electrical equipment at any hardware shop in Australia
as back up is from the mains power lines
drains which we built ourselves we residents and businesses keep over 4 million litres of stormwater from roofs to irrigate road verge gardens.
anywhere.
City Council are working together to make Chippendale Sustainable – see: www.sustainablechippendale.com