
SLIDE 1
Heatwaves in Germany
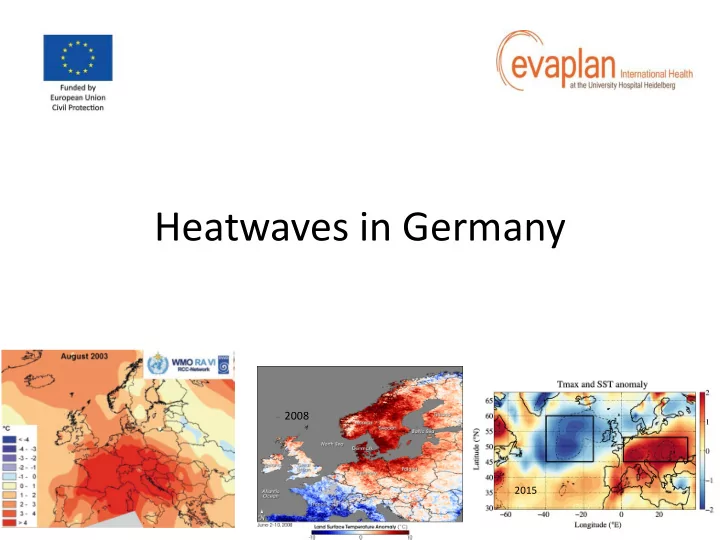
2008
2015
Heatwaves in Germany 2008 2015 Outline - Questions 1. Is heatwave - - PowerPoint PPT Presentation
Heatwaves in Germany 2008 2015 Outline - Questions 1. Is heatwave a problem in Germany? 2. Why is it a problem? 3. What is scope of the problem? 4. What are the resilience mechanisms/strategies against heatwaves in Germany? 5. How is the
2008
2015
Natural disasters N Deaths Injured Affected Home- less Damage (M. US$) Earthquake 3 1 60 1650 200 212 Epidemic 2 609 Extreme temperature 12 9420 165 2,030 Flood 24 74 120 547100 29,010 Landslide 1 5 6 Storm 57 710 755 30000 30,721 Wildfire 1 Grand Total 100 10210 1100 579359 200 61979 92% of deaths (mostly in 2003); 46 % of damage costs
Year N Deaths Injured Damage (M US$) 1979 1 80 1997 1 30 2003 1 9355 1,650 2005 1 1 165 300 2006 2 12 2009 2 15 2010 1 1 2012 2 6 2018 1 Total 12 9420 165 2,030
https://www.umweltbundesamt.de/daten/umwelt-gesundheit/gesundheitsrisiken-durch-hitze#textpart-3
https://www.umweltbundesamt.de/daten/umwelt-gesundheit/gesundheitsrisiken-durch-hitze
2003 2015 2018
2003 2015 2018
https://www.umweltbundesamt.de/daten/umwelt- gesundheit/gesundheitsrisiken-durch-ozon#textpart-1
https://www.rki.de/DE/Content/Kommissionen/UmweltKommission/Stellun gnahmen_Berichte/Downloads/klimawandel_gesundheit_handlungsempfehl ungen_2013.pdf?__blob=publicationFile
– Bund – Friends of the Earth Germany (www.bund.net) – NABU-Projekt „ StadtKlimaWandel“: www.nabu.de/aktionenundprojekte/stadtklimawandel/ – GRaBS – Green and Blue Space Adaption for Urban Areas and Eco Towns: www.grabs-eu.org
– Regionale Klimabüros der Helmholtz-Gemeinschaft: www.klimabuero.de – Regionaler Klimaatlas Deutschland: www.regionaler-klimaatlas.de – KlimaMORO – Raumentwicklungsstrategien zum Klimawandel: www.klimamoro.de – KlimaExWoSt – Urbane Strategien zum Klimawandel; StadtKlima – Kommunale Strategien und Potenziale – zum Klimawandel: www.klimaexwost.de – KLIMZUG – Klimawandel in Regionen zukunftsfähig gestalten: www.klimzug.de – Klimalotse – Leitfaden zur Anpassung an den Klimawandel: www.klimalotse.anpassung.net
Gesundheitliche Risiken von Ozon und hoher Lufttemperatur https://www.umweltbundesamt.de/daten/umwelt-gesundheit/gesundheitsrisiken-durch-ozon#textpart-1 https://www.umweltbundesamt.de/sites/default/files/medien/1410/publikationen/190211_uba_hg_luftqu alitaet_dt_bf.pdf#page=4&zoom=auto,-13,334 https://www.umweltbundesamt.de/sites/default/files/medien/4031/publikationen/uba_krug_muecke.pdf https://www.umweltbundesamt.de/themen/klimawandel-gesundheit-anpassungsmassnahmen-im https://www.umweltbundesamt.de/publikationen/klimawandel-gesundheit Steffen Merte: Estimating heat wave-related mortality in Europe using singular spectrum analysis. In: Climatic
Seit Januar 2010 darf ein Kubikmeter (m³) Luft im 8-Stunden-Mittel nicht mehr als 120 Mikrogramm (µg) Ozon enthalten. Dieser Wert durfte in einem Jahr 25-mal überschritten werden.
2008 http://wiki.bildungsserver.de/klimawandel/ind ex.php/Hitzewellen_Europa 2003 2015