
SLIDE 1
Meeting Community Sustainability Goals Through Coordinated Development and Transportation Strategies
May 20, 2013
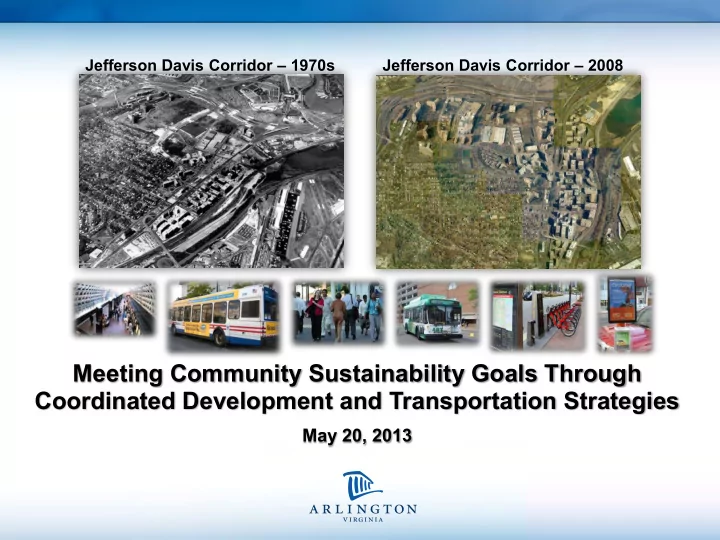
Jefferson Davis Corridor – 1970s Jefferson Davis Corridor – 2008
Meeting Community Sustainability Goals Through Coordinated - - PowerPoint PPT Presentation
Jefferson Davis Corridor 1970s Jefferson Davis Corridor 2008 Meeting Community Sustainability Goals Through Coordinated Development and Transportation Strategies May 20, 2013 The Community Sustainability Transportation Question
Meeting Community Sustainability Goals Through Coordinated Development and Transportation Strategies
May 20, 2013
Jefferson Davis Corridor – 1970s Jefferson Davis Corridor – 2008
improved environmental performance and quality of life while reducing reliance on auto travel and associated VMT growth?
– In Arlington, the answer is yes, but it takes commitment and continued innovation – Transportation infrastructure investments and services must be closely aligned with development
– The reduced reliance on auto travel yields many other community benefits: more efficient use of land, reduced environmental impacts, lower energy use, a lower carbon footprint, improved public health
2
3
4
residents, 3 million jobs and 1,200 sq. miles of urbanized area)
by 2040 (212,900 residents and 228,700 jobs in January 2013)
employment growth forecasts for established transit districts (Rosslyn- Ballston, Jefferson Davis and Columbia Pike Corridors)
100,000 200,000 300,000 400,000
1970 1980 1990 2000 2010 2020 2030 2040
Households Residents Jobs
5
density redevelopment around transit stations (highly targeted) and taper down to existing neighborhoods
services in station areas
environments and enhanced
established residential neighborhoods
6
Rosslyn-Ballston Corridor Jefferson Davis Corridor
Columbia Pike
7
with over 4 million sq. ft. of supporting retail & services
under construction as of January 2013. * Includes the Pentagon @ 5 million sq. Ft.
9
10
11
miles of HOV lanes
parking spaces
stations
local bus (ART) service
with over 80 cars
50 stations w/ 36 additional stations funded
miles of on-street bike lanes and sharrows
sidewalks
– Over 212,900 in January 2013 – Over 140,000 workers with 70% working
– Lowest resident drive-alone commute rate in all VA regions – 46% residents use non-SOV as primary commute mode
jobs
– Over 228,700 jobs in 2013 – 200,000+ jobs clustered around transit in Arlington’s high-density corridors. – 160,000+ workers commute into Arlington daily Over 40% take transit, walk or bike to work.
– 4 million plus visitors to Arlington National Cemetery – Over 10,500 hotel rooms used as a base for visitors from outside the region – Many daily visitors from adjacent jurisdictions
12
13
Metro Corridors by SOV
14
development around transit stations
choices
including expansion of transit service to development
information and encouragement
requirements
management (supply and pricing)
15
Transportation Partners
and Support – three commuter stores, one mobile store
BikeArlington, WalkArlington, Carsharing, Bikesharing
Mobility Lab
16
wide Commuter Services programs
including sidewalk/streetscape and bicycle facilities
performance surveys
17
EPA – Potomac Yard (completed 2006) ATP participant Employee transit subsidies Dedicated transitway and station Sidewalk and bicycle improvements Market-rate parking charges On-site transportation coordinator
supply – Residential permit parking – On-street metered parking
parking – Parking information – Shared/public parking – Pricing – Amount provided
18
(Blue and Yellow lines)
19
One square mile area
2 stations (Pentagon City, Crystal City)
Adjacent to the Pentagon and National Airport
12.8 million sq. ft. of office space
13,300 housing units
2.5 million sq. ft. of retail space
20
10,915 5,828* 12,457 4,333 2,202 998 2,416 922* 246 3,668 1,569* 1,904 5,231 2,452* 42,628
#,### - Population #,### - Households #,### - Jobs
22202 Totals Population = 26,563 Households = 12,973 Jobs = 89,280
21
15,413 (41%)
4,339
2,425
4,187 (14%)
8,833 (69%)
#,### - Population #,### - Households #,### - Jobs
22202 Totals Population = 35,197 (33%)
22
23
Pentagon Pentagon City Ronald Reagan Washington National Airport Crystal C i ty
eo eo eo
e o
7P, 7W, 7X, 7Y, SS, SW, SX. SZ, 9A. 9E, 10A. 10E, 13F, 13G, 16A. 168, 160, 16E, 16G, 16H, 16J, 16K, 16L, 16X, 16P
, 16X, 17A. 178, 17F, 17G, 17H, 17K, 17L, 17M, 1SE, 18F, 18C, 18H,
18J, 18P, 21A, 21D, 22A,
2SE, 2SF, 28C, 29C, 29E, 29G,29H,29X
ART: 42, 87, 87X DASH: 3, 4; FC 306, 395, 595
ART: 74, 84
13F , 13G 9S, 10E, 16H, 23A. 23C
FC: 597
(Bus and Rail)
:i:: ~m
28TH ST !!l
f'~
S GLEBE RD
ii Cl
~
¢,...
..
~ !'!-
~ g
10
~
'1'3 'kCrxstal City
~ [11v1
Ronald Reagan Washington National Airport
PARK FAIRFAX
~
~
._i.=.L.:-L£u.;:~-r.L.-~
~-J~
AL
Jl_
~
~-L.
L-_.!.~
ARLINGTON
Vl&.GlNIA support the complete range of multi-modal users.
City, improving pedestrian and vehicular connectivity.
station.
use neighborhoods were people can live and work in the same place.
24
25
– Fiber optic network – CCTV camera program – Emergency vehicle signal pre-emption – Transit signal priority – Automated traffic count station program – Automate bicycle and pedestrian count station program – Real time transit vehicle tracking and reporting – Real time transit information displays
26
27
Street Segment Street Type 1996 2001 2006 2009 2011/2012 % Change 1996-2012
Columbia Pike w/o Glebe EW 5-lane arterial 32,000 22,612 28,000 28,000 NA
Columbia Pike e/o Wash. Blvd. EW 4-lane arterial NA 13,000 12,000 12,000 10,000
Glebe Rd. s/o Columbia Pike NS 4-lane arterial 29,000 32,000 28,000 26,000 27,000
Hayes Street n/o 15th St. NS 6-lane arterial 21,426 14,200 13,900 NA 13,540
n/o 18th St. NS 4-lane arterial NA 9,140 8,270 NA 9,230 .98% Jeff Davis Hwy n/o Glebe Rd NS 6-lane arterial 52,000 NA 44,000 43,000 44,000
Arlington Ridge Rd s/o 23rd Street NS 2-lane arterial 14,584 12,570 13,250 NA 13,680
Corridor and S. Glebe Road (highest density
– Identification of
– Traffic studies – Incident management – Special events
28
construction and an additional 54 planned (4 stations operational and 4 in testing in the study area)
collection
classification and volume
365 days per year
29
30
31
1000 2000 3000 4000 5000 6000 7000 8000 9000 M T W T F Average Daily Volume
NB Crystal Drive - Avg. Weekday Volumes By Month
Feb-12 Feb-13 Mar-12 Mar-13 Apr-12 Apr-13
Automatic Bicycle & Pedestrian Counting Equipment
32
33
FY1996 Actual FY 2001 Actual FY 2006 Actual FY 2009 Actual FY2012 Actual FY2013 Projected % Growth Metrorail Arlington Stations
45,335,000 56,278,412 60,864,000 61,935,000 61,014,000 61,929,275
36.6% Metrobus Arlington Routes
12,049,000 11,614,599 13,221,100 16,135,000 15,056,000 15,206,378
26.2% VRE – Crystal City
567,000 586,069 992,600 998,903 1,142,000 1,154,800
103.7% Arlington Transit (ART)
105,000 147,813 926,600 1,428,800 2,537,000 2,780,000
2,648% Total Annual Ridership
58,076,000 68,626,893 76,004,300 81,916,996 79,749,000 81,070,453
39.6%
34
674,806 926,574 1,060,441 1,225,427 1,428,827 1,990,402 2,261,100 2,537,000 2,780,000
500,000 1,000,000 1,500,000 2,000,000 2,500,000 3,000,000
FY 05 FY 06 FY 07 FY 08 FY 09 FY 10 FY 11 FY 12 FY 13
Fiscal Year Annual Ridership * Two of the highest ridership routes serve Pentagon City and the Pentagon (ART 42 and ART 87)
permits:
– Plans & ongoing reporting required for all site plans/use permits and public facilities – Plans require on-site management, facilities, information services, transit subsidies and other elements to maximize use of transit, carpool/vanpool, telework, flex schedules, walking and biking – All site plan requirements are actively tracked for compliance – County staff/contractors also maintain ongoing outreach and support to building tenants in the case of employment sites – Sites with robust transportation demand management plan implementation can achieve a 20% drive-along share reduction over similar sites without TDM programs, hotel and residential properties
35
cont’d
Commuter Services:
– Ongoing education, research, sales, marketing, web information/transaction support for transportation options at employment, hotel and residential properties – Most employers, all hotels and most multi-family properties participate – Most comprehensive TDM program in Virginia and in the Washington region responsible for removing over 45,000 daily vehicle trips from Arlington streets (scope is greater than all regional and local government TDM programs combined)
36
37
38
ARLINGTON
VIIGINIAARL I GTO -
\ A
ARLI NGTO COU NTY CO
UTER SER VICES
I
June 16, 2011
~
L D A l o NSULTlNG
ARI l "-:GTON
\I
All n&tJn Transio1.ttJ011 Partnen I Tiie Canmutet Sun I
Corrun:l•etl'a£o .con I CcminutetOwect.con I B • io'a i. Atlul£lon
39
Auto Driver Auto Passenger Transit Walk/ Bike School Bus/Other Core District of Columbia 7.0 37.0 14.4 18.3 27.5 2.5 2.6 12.8 13.60% Arlington 7.8 52.9 16.5 10.7 16.6 3.3 4.1 21.6 5.26%
6.0 45.0 13.4 19.0 19.7 2.9 2.7 17.4
5.6 35.2 11.2 20.6 29.2 3.8 2.0 10.9
6.5 58.2 16.0 11.3 12.1 2.4 3.9 21.2
6.2 64.5 8.2 12.3 13.9 1.1 4.0 19.3
9.6 56.0 18.5 6.8 15.1 3.6 5.4 26.1 Alexandria 7.1 56.1 16.9 9.2 15.9 1.9 4.0 22.1 3.60% Inner Suburbs Fairfax County 9.1 61.1 25.0 4.0 5.4 4.4 5.6 35.2 19.27% Montgomery County 9.4 57.4 23.0 5.7 9.4 4.5 5.4 33.3 18.89% Prince Georges County 8.3 58.1 25.2 6.5 5.8 4.5 4.8 36.3 16.80% Outer Suburbs Loudoun County 8.8 63.3 26.4 1.3 3.9 5.2 5.6 50.1 5.42% Prince William County 9.9 59.7 28.9 2.2 4.1 5.1 5.9 51.0 8.13% Frederick County 9.8 64.7 25.0 1.3 4.8 4.2 6.3 57.4 2.67% Charles County 9.4 64.5 24.9 1.8 2.5 6.2 6.1 65.6 4.50% Regional Average VMT per HH 34.19 Arlington Ave HH VMT/Region Ave HH VMT 63.18% Arlington Metro Corridors HH VMT/Regional Average HH VMT 45.70%
updated - June 1, 2011 Uses expanded Arlington dataset with new regional weighting factors Results updated only for Arlington
% of of Daily Household Trips by Mode of Travel Jurisdiction in the Greater Metropolitan Washington Region Average Weekday Trips per Household Average Weekday Auto Driver Trips* Average Weekday Auto Driver VMT % of Regional HH
40
ARLINGTON
VIIGINIAJust Over a Third of Trips to Rosslyn-Ballston Corridor
and Jeff Davis Corridor are Drive Alone
D Drive/ride w/ others
R-B Corridor
Jeff Davis Corridor Columbia Pike Shirtington
Other
Artington 0% 20% 40% 60%
80%
100% •
E~
1
~
41
ARLINGTON
VIIGINIAJeff Davis and Rosslyn-Ballston Residents Make Substantially More Daily Transit/Walk Trips than do Other Arlington Residents
Rosslyn-Ballston Jeff Davis Columbia Pike Shirlington Other Arlington
Transit/
......-------.-------.-------.-------. Walk Trips
0.7
1.4
0.8
1.8
0.8
1.0
0.8
1.0 2.0 3.0 4.0
Average Trips per person by mode
L D A CONSULTING
82 ---
Southeastern Institute of Research
42
ARLINGTON
VIIGINIADecember 2009
Prepared For
Arlington County Commuter Services
Prepared By
L , D A
,_
43
ARLINGTON
VIIGINIAPrimary Mode by Area
The DA rate was similar for Ballston, Rosslyn, and Crystal City, but dramatically higher (79% ) for areas outside Metro corridors. Crystal City had the highest transit share, but Ballston had much higher bike/walk use. CP /VP use was similar in the three Metro corridors and lower in "Other" areas.
100° ,.i
79% 80%
D Bike/walk D Carpool/vanpool
60% 47% 40% 20% 0%
Ballston/Courthouse Rosslyn Crystal City Other Q 3 How many weekdays would you typically use each of the following types of transportation to get to [street address)?
44
ARLINGTON
VIIGINIAPrimary Mode by Urban Level
The DA rate was much higher for Low Urban areas than for areas
Urban likely reflects the large role of Crystal City in this group.
100% ....-----------i • Drive alone
D Bike/walk
800,.6 800,.6 600,.6 400,.6 200,.6
2% 3%
00,.6
Low urban
46% 41% 5% 6%
Moderate urban
D Carpool/vanpool High urban Very high urban Q 3 How many weekdays would you typically use each of the following types of transportation to
get to [street address)?
45
ARLINGTON
VIIGINIAPrimary Mode by Metro Distance
DA rates were much lower and transit use was considerably
higher for respondents who worked within 5 blocks of a Metrorail stations than for respondents who worked farther away from
for 0-2 blocks and 3-5 blocks from Metro.
1000,{,
79% 800
,{,
D Bike/walk D Carpool/vanpool
600 ,{, 43%43% 400 ,{, 200,{,
OOA.
0 -2 blocks 3-5 blocks
6-10 blocks
>1 0 blocks Q 3 How many weekdays would you typically use each of the following types of transportation to get to [street address]?
E
ft ~
46
ARLINGTON
VIIGINIAPrimary Mode by Total TDM Level
The DA rate dropped substantially as TDM level rose Low TDM - 62%
DA, Moderate TDM - 47% DA, High TDM - 40% DA
The different primarily reflects growing transit share with higher TDM levels. Carpool/vanpool rates were essentially the same.
62% I DA drop from Low to High TOM
.
.
DA Transit 100
...6 6% 7%
Bike/walk
_
____,
D High TOM 6% 7% 7%
Carpool/vanpool
Q 3 How many weekdays would you typically use each of the following types of transportation to
get to [street address]?
164
~
E
l =I
47
ARLINGTON
VIIGINIAPrimary Mode by Parking Ratio
The DA rate increased as the parking ratio increased - as more parking was available, more employees chose to drive to work. But the most dramatic increase was when parking was available to all employees.
Generally upward trend in DA rate from limited parking to ample parking
0 -0 .25 0 .26-0. 5
0.51-0.75
67% 0 .91 or more
Q 3 How many weekdays would you typically use each of the following types of transportation to get to [street
address]?
1 61
~
E
ft
=I
48
ARLINGTON
VIIGINIAPrimary Mode by Parking Fee (Perceived by Employee)
Parking fee seemed to have little impact on DA rates, until the fee climbed above $100. At that point, DA rates fell sharply.
DA drop from
so% -------------....+:;ll..o,f....------1 modest to high
parking charge
600
/o
40%
200/o 00 /o $1 - $75 $76 - $100 $100 - $124 $125 or more
Q 3 How many weekdays would you typically use each of the following types of transportation to get to [street address]? Q9a How much do you, or would you, pay to park at this location?
49
Joyce St. to 12th St S.
pedestrian crossings, improved pedestrian space and separated two-way cycle track.
from Army Navy Dr. to 15th St. S.
Mid-block crossings, HAWK Signals, Green Bicycle Lanes, Street Lighting, Transit and Bicycle Amenities
Complete 2013)
bicycle and pedestrian facilities north of S. Joyce St./Army Navy Dr.
Defense)
50
signals, street lights
lighting and traffic signals
parking, new signals and street lighting
South, 33rd Street South
51
bicycle facilities
ramps
Memorial Bridge
53
S-T'e. ....
... _
.. :.-.c ....
. ..
~,.,., .__. - ._,,.,_
.. -c....
"' ""'-'*'
.,.,.~=-lIDt-
ARLINGTON
VIIGINIA. n County ITS Master Plan Arhngto
0 e Den/
Phme n " N
0.5
54
55
56
57
Location Stop Design (North End) Stop Design (South End)
58
Rendering of Proposed 12th Street Station Example of Streetcar Elsewhere Location of Planned Alignment
59
60
environmental benefits - allowing continued growth with less reliance on auto trips, and more use of transit and other travel options.
as:
– Building mixed use environments with highest densities around transit stops – Expanding viable and attractive transportation options – Making user information readily available and providing ongoing education and encouragement – Sustaining and strengthening transportation demand management (TDM) – Actively managing parking
infrastructure and on-going monitoring.
sustaining and enhancing programs and policies over time
assimilation of best practices from other communities in the US and abroad
61
Effectiveness Coordinated Development & Transportation Strategies
Contact Information:
Dennis M. Leach, AICP Director of Transportation Arlington County Department of Environmental Services Division of Transportation & Development 703-228-0588 dleach@arlingtonva.us
62