
SLIDE 1
9/20/2011 1
Measuring Customer Value: A Different Perspective on Price Optimization
October 3 – 4, 2011 CAS I F S i CAS In Focus Seminar Roosevelt C. Mosley, Jr., FCAS, MAAA Pinnacle Actuarial Resources, Inc.
Experience the Pinnacle Difference!
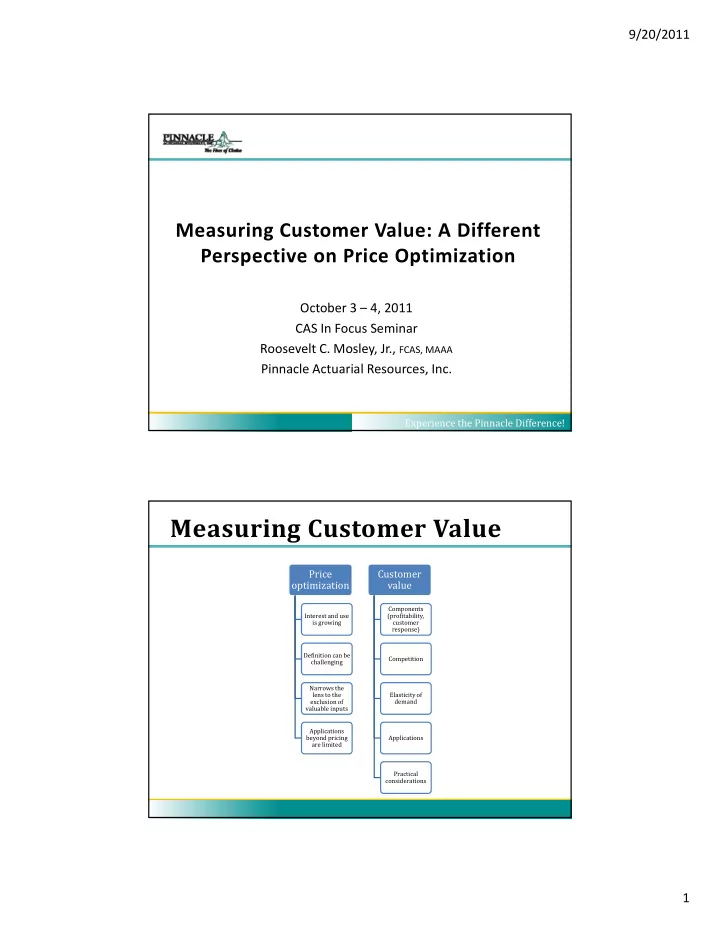
Measuring Customer Value
Price
- ptimization
Customer value
Interest and use is growing Definition can be challenging Narrows the lens to the exclusion of valuable inputs Components (profitability, customer response) Competition Elasticity of demand Applications beyond pricing are limited Applications Practical considerations