
SLIDE 1
1
Measurement Study of Low- bitrate Internet Video Streaming
Dmitri Loguinov and Hayder Radha CS Dept at CUNY NY and EE/ECE at MSU. In Proceedings of ACM SIGCOMM Workshop
- n Internet Measurement
November 2002
Introduction
- Many studies of Internet performance
– Paxson, Mogul, Caceres… – Across countries, many sites – Well-connected (often schools on backbone)
- But few look at it from the point of dialup user
– About 50% of home users dialup
- Peak, but will remain majority for 3-5 years
– ISP cannot always do 56 kb/s
Introduction
- Most studies involve TCP
– 90-99% of traffic on Internet is TCP
- But MM prefers UDP
– (Why?)
- Also, TCP uses ACK-based scheme
– MM protocols prefer NACK to scale (why?)
- Video studies have done few paths
Introduction
- Video streaming experiment
– Seven month long – MPEG-4 (low-bandwidth) over UDP – Over dialup – 600 major cities – 50 States
Outline
- Introduction
(done)
- Methodology
- – Setup
– Streaming – Client-Server architecture
- Results
- Analysis
- Summary
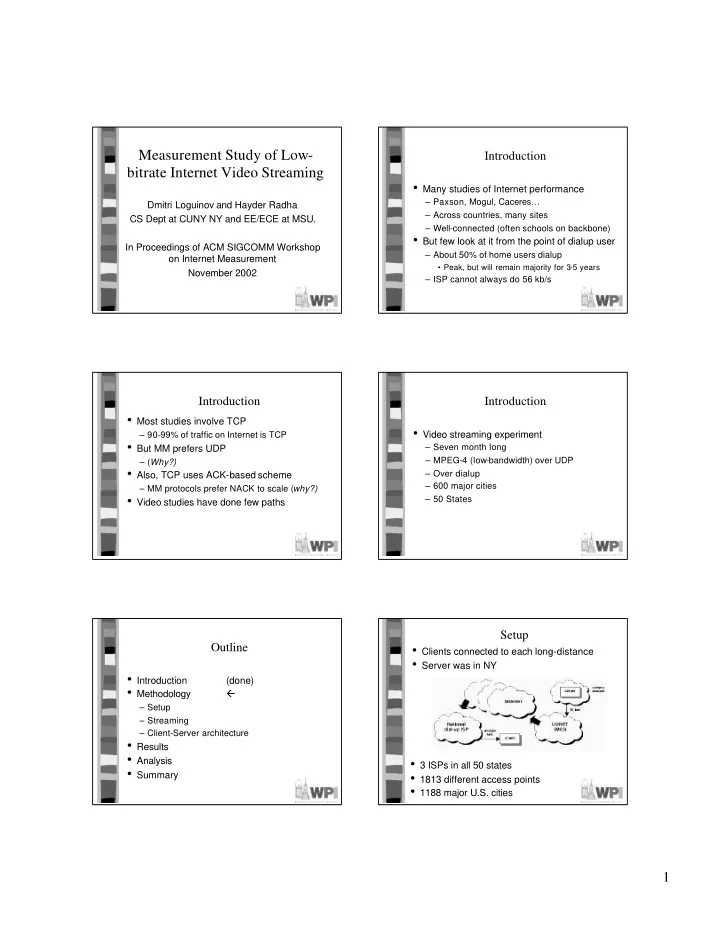
Setup
- Clients connected to each long-distance
- Server was in NY
- 3 ISPs in all 50 states
- 1813 different access points
- 1188 major U.S. cities