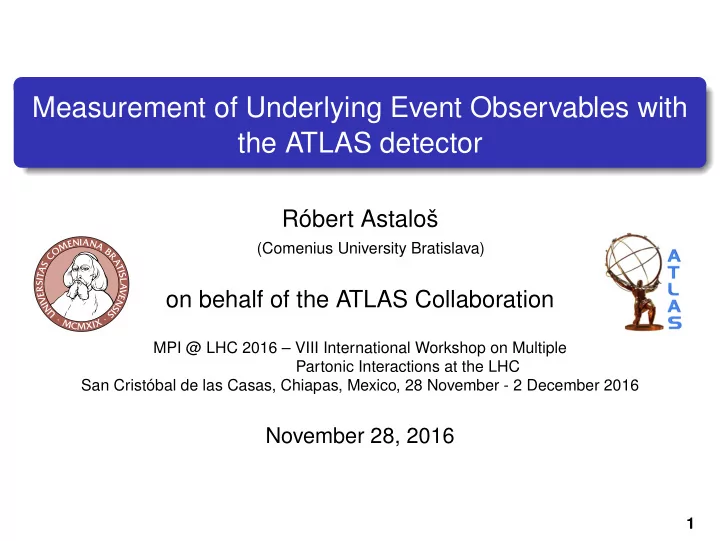
measurement of underlying event observables with the
play

Measurement of Underlying Event Observables with the ATLAS detector - PowerPoint PPT Presentation

Measurement of Underlying Event Observables with the ATLAS detector Rbert Astalo (Comenius University Bratislava) on behalf of the ATLAS Collaboration MPI @ LHC 2016 VIII International Workshop on Multiple Partonic Interactions at the


  1. Measurement of Underlying Event Observables with the ATLAS detector Róbert Astaloš (Comenius University Bratislava) on behalf of the ATLAS Collaboration MPI @ LHC 2016 – VIII International Workshop on Multiple Partonic Interactions at the LHC San Cristóbal de las Casas, Chiapas, Mexico, 28 November - 2 December 2016 November 28, 2016 1

  2. Overview Measurement of charged-particle distributions sensitive to underlying event in √ s = 13 TeV proton-proton collisions with the ATLAS detector at the LHC – Preliminary results Measurement of event-shape observables in Z → ℓ + ℓ − events in pp collisions at √ s = 7 TeV with the ATLAS detector at the LHC Eur. Phys. J. C. (2016) 76:375, arXiv:1602.08980 2

  3. Motivation Underlying Event = soft processes unavoidably accompanying hard parton-parton scatterings in pp collisions with a high momentum transfer interactions between proton remnants, MPI, initial and final state QCD radiation Soft interactions not reliably calculable by theory – dominated by low-scale QCD interactions, in which the strong coupling strength diverges and pertubative methods of QCD lose predictivity ⇒ described by phenomenological models, implemented in MC event generators ⇒ contain many free parameters which are needed to be constrained by measurements. 3

  4. Measurement of Underlying Event leading charged particle η, ϕ plane divided into regions around leading (the highest p T ) object (track, calo. cluster, jet...): | ∆ ϕ | < 60 ◦ - toward − ∆ φ ∆ φ 60 ◦ < | ∆ ϕ | < 120 ◦ - transverse | ∆ ϕ | > 120 ◦ - away towards | ∆ φ | < 60 ◦ towards and away regions dominated by transverse (min) transverse (max) 60 ◦ < | ∆ φ | < 120 ◦ 60 ◦ < | ∆ φ | < 120 ◦ particle production from the hard process → relatively insensitive to the softer UE away | ∆ φ | > 120 ◦ transverse region more sensitive to UE further subdivision of the observables on an event-by-event basis depending on which side of the event is more activity: trans-max : observables in the more-active transverse region (higher � p T ) includes both MPI and hard-process contamination trans-min : observables in the less-active transverse region (lower � p T ) most sensitive to MPI effects (pedestal) trans-diff : difference of trans-max and trans-min clearest measure of hard-process contamination 4

  5. Measured Observables Observable Description binned variables p lead Transverse momentum of the leading charged particle T | ∆ φ | Absolute difference in particle azimuthal angle from the leading particle unbinned variables � � N ch /δηδφ Mean number of charged particles per unit η − φ (in radians) �� p T /δηδφ � Mean scalar p T sum of charged particles per unit η − φ (in radians) δφ = 2 π/ 3 – for toward, away an transverse regions π/ 3 – for the single-sided trans-min and trans-max regions 2 π/ n bins – for each of the n bins equally-sized bins in | ∆ φ | distributions δη = 5 in all cases mostly dependences of these quantities on the p lead : T low → high p lead ∝ smooth transition: minimum bias → hard scattering regime T 5

  6. Event and Track Selection √ s = 13 TeV data taken in a special configuration of the LHC: low beam currents, reduced beam focusing, producing a low mean � � number of interactions per bunch (0.003 ≤ µ ≤ 0.03) trigger: one or more MBTS counters above treshold on either side of the detector integrated luminosity of 1 . 6 nb − 1 events: required to contain 1 reconstructed vertex from ≥ 2 tracks with p T > 100 MeV required to contain at least one track with p lead > 1 GeV T corrected to the particle level, including a correction for leading particle realignment 66 million data events passed the trigger and vertex selection track selection criteria: p T > 0 . 5 GeV ; | η | < 2 . 5 6

  7. Leading charged particle p T and Angular distributions 〉 [GeV] φ δ η η p > 0.5 GeV, | | < 2.5 ATLAS Preliminary p > 0.5 GeV, | | < 2.5 ATLAS Preliminary 3 η T T ] 10 -1 -1 -1 δ 10 s = 13 TeV, 1.6 nb s = 13 TeV, 1.6 nb 〉 [GeV / p lead > 1 GeV ATLAS Preliminary φ ch 10 2 δ T N p lead > 10 GeV PYTHIA 8 A14 p lead > 10 GeV PYTHIA 8 A14 η 10 η -1 p > 0.5 GeV, | | < 2.5 s = 13 TeV, 1.6 nb T T lead 〈 δ lead lead T p > 1 GeV PYTHIA 8 Monash / p > 1 GeV PYTHIA 8 Monash 10 T T / d p T p T Herwig7 Herwig7 Data PYTHIA 8 Monash Σ 1 PYTHIA 8 A14 Herwig7 〈 ev Epos Epos dN PYTHIA 8 A2 Epos − 10 1 ev 1/N 1 − 2 10 1 − 10 3 − 4 10 − 5 10 MC / Data MC / Data 1.1 lead 1.1 lead p > 10 GeV p > 10 GeV T T 1 1 Model / Data 1.4 0.9 0.9 1.2 0.8 0.8 MC / Data MC / Data 1 lead lead p > 1 GeV p > 1 GeV 1.2 1.2 T T 0.8 1 1 5 10 15 20 25 30 0.8 0.8 lead p [GeV] T 0 20 40 60 80 100 120 140 160 180 0 20 40 60 80 100 120 140 160 180 | ∆ φ | [degrees] ∆ | φ | [degrees] N ev vs p lead : steeply falling distribution with a change of slope for p lead ≥ 5 GeV T T broadly modelled by all generators, best description by EPOS and PYTHIA 8 A14 p lead > 1 GeV → p lead > 10 GeV – transition from relatively isotropic minimum bias T T scattering to the emergence of hard partonic scattering structure and a dominant axis of energy flow, no clear best MC: more inclusive selection ( p lead > 1 GeV) – EPOS T hard-scattering selection ( p lead > 10 GeV) – HERWIG7 and Pythia 8 Monash T 7

  8. N ch and � p T densities in azimuthal regions 8 〉 [GeV] 2.5 φ η η p > 0.5 GeV, | | < 2.5 ATLAS Preliminary p > 0.5 GeV, | | < 2.5 ATLAS Preliminary δ T T η -1 7 -1 s = 13 TeV, 1.6 nb s = 13 TeV, 1.6 nb δ 〉 / φ ch 2 δ N 6 η Towards region 〈 δ / Transverse region T 5 p Away region 1.5 Σ 〈 4 1 3 2 Towards region 0.5 Transverse region 1 Away region 0 0 5 10 15 20 25 30 5 10 15 20 25 30 lead lead p [GeV] p [GeV] T T general shape: first very rapid rise in activity – 3 regions not strongly distinguished abrupt transition at p lead ≈ 5 GeV, above it distinct behavior of 3 regions T different shape of the transverse region: almost completely plateaus after p lead ≈ 5 GeV T → hard process dominates the towards and away regions, which continue to increase in activity as the hard process scale grows, but transverse region is relatively unaffected p lead > 7 GeV: away region with highest multiplicity, despite not containing p lead track T the towards region is the most active by � p T for all p lead T values T 8

  9. � p T densities in trans-min/max/diff regions 1.6 [GeV] 3 1.6 [GeV] [GeV] Trans-min region ATLAS Preliminary Trans-max region ATLAS Preliminary Trans-diff region ATLAS Preliminary 1.4 1.4 〉 η -1 p > 0.5 GeV, | | < 2.5 s = 13 TeV, 1.6 nb η -1 η -1 〉 2.5 p > 0.5 GeV, | | < 2.5 s = 13 TeV, 1.6 nb 〉 p > 0.5 GeV, | | < 2.5 s = 13 TeV, 1.6 nb φ T φ φ δ T T 1.2 p lead > 1 GeV δ δ lead 1.2 lead η p > 1 GeV p > 1 GeV T η η δ T T δ δ / 2 T / / 1 p T T 1 p p Σ Σ Σ 〈 0.8 〈 〈 1.5 0.8 0.6 0.6 1 0.4 Data PYTHIA 8 Monash 0.4 Data PYTHIA 8 Monash Data PYTHIA 8 Monash PYTHIA 8 A14 Herwig7 PYTHIA 8 A14 Herwig7 PYTHIA 8 A14 Herwig7 0.5 0.2 PYTHIA 8 A2 Epos 0.2 PYTHIA 8 A2 Epos PYTHIA 8 A2 Epos Model / Data Model / Data Model / Data 1 1 1 0.8 0.8 0.8 5 10 15 20 25 30 5 10 15 20 25 30 5 10 15 20 25 30 p lead [GeV] lead lead p [GeV] p [GeV] T T T trans-min: best description by PYTHIA 8 Monash and Herwig7 (in the plateau region) PYTHIA 8 A2 (mild but broad undershoot extending up to p lead ≈ 20 GeV) T and Herwig7 (severe undershoot for p lead < 5 GeV) mismodel the transition T trans-max: similar, undershoot of PYTHIA 8 A2 slightly better trans-diff: best description by PYTHIA 8 Monash and A2 tunes EPOS not able to model the level of underlying event activity for higher p lead T PYTHIA 8 A14 used much for the hard process simulation in ATLAS predicts activity ∼ 10 % below the data → some re-tuning for 13 TeV event modelling may yield performance benefits 9 trans-max: models cluster together more tightly providing good description for

Download Presentation
Download Policy: The content available on the website is offered to you 'AS IS' for your personal information and use only. It cannot be commercialized, licensed, or distributed on other websites without prior consent from the author. To download a presentation, simply click this link. If you encounter any difficulties during the download process, it's possible that the publisher has removed the file from their server.

Recommend


More recommend