
SLIDE 1
11/9/2017 1
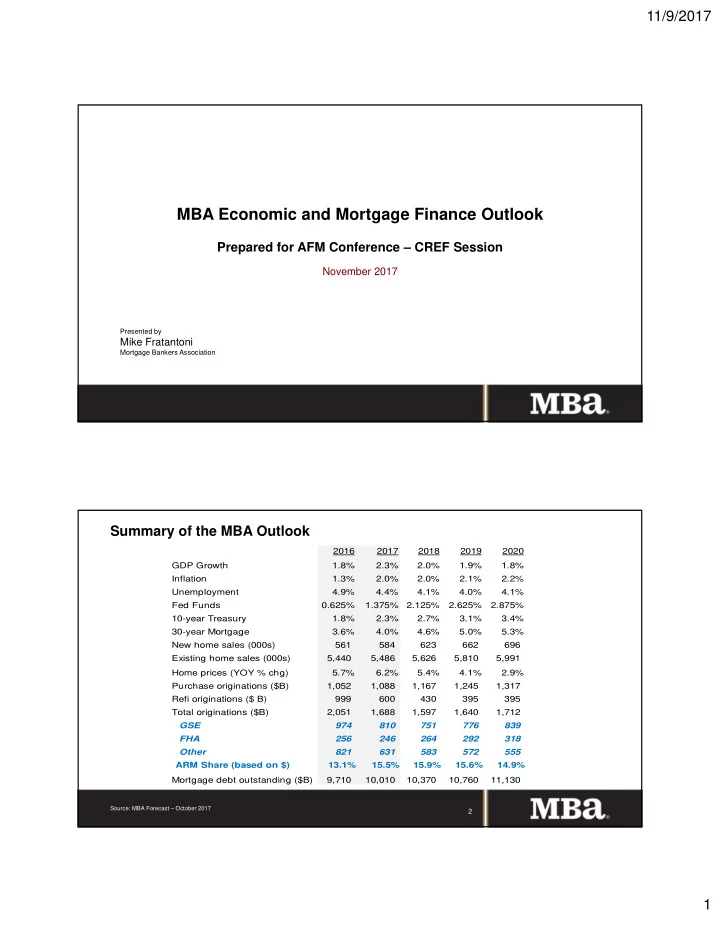
MBA Economic and Mortgage Finance Outlook
Prepared for AFM Conference – CREF Session
November 2017
Presented by
Mike Fratantoni
Mortgage Bankers Association
Summary of the MBA Outlook
Source: MBA Forecast – October 2017
2
MBA Economic and Mortgage Finance Outlook Prepared for AFM - - PDF document
11/9/2017 MBA Economic and Mortgage Finance Outlook Prepared for AFM Conference CREF Session November 2017 Presented by Mike Fratantoni Mortgage Bankers Association Summary of the MBA Outlook 2016 2017 2018 2019 2020 GDP Growth
Presented by
Mortgage Bankers Association
Source: MBA Forecast – October 2017
2
Source: BLS
3
235 284 254 265 163 (144) (42) 10 170 210 174 96 (297) (422) 88 174 179 192 250 226 187 216 232 50 207 145 210 138 208 18 261 (500) (400) (300) (200) (100)
200 300 400 Thousands of jobs
Source: NFIB
4 (5.0) ‐ 5.0 10.0 15.0 20.0 25.0 30.0 35.0 40.0 Jan‐86 Dec‐86 Nov‐87 Oct‐88 Sep‐89 Aug‐90 Jul‐91 Jun‐92 May‐93 Apr‐94 Mar‐95 Feb‐96 Jan‐97 Dec‐97 Nov‐98 Oct‐99 Sep‐00 Aug‐01 Jul‐02 Jun‐03 May‐04 Apr‐05 Mar‐06 Feb‐07 Jan‐08 Dec‐08 Nov‐09 Oct‐10 Sep‐11 Aug‐12 Jul‐13 Jun‐14 May‐15 Apr‐16 Mar‐17
Percent of firms with hard to fill job openings, (%, SA) Net percent of firms planning to raise compensation, (%, SA)
Source: Federal Reserve Bank of Atlanta
5 0.0 1.0 2.0 3.0 4.0 5.0 6.0
Percent
Source: BLS
6 (40.0) (30.0) (20.0) (10.0) ‐ 10.0 20.0 30.0 40.0 (4.0) (3.0) (2.0) (1.0) ‐ 1.0 2.0 3.0 4.0 Jan‐14 Feb‐14 Mar‐14 Apr‐14 May‐14 Jun‐14 Jul‐14 Aug‐14 Sep‐14 Oct‐14 Nov‐14 Dec‐14 Jan‐15 Feb‐15 Mar‐15 Apr‐15 May‐15 Jun‐15 Jul‐15 Aug‐15 Sep‐15 Oct‐15 Nov‐15 Dec‐15 Jan‐16 Feb‐16 Mar‐16 Apr‐16 May‐16 Jun‐16 Jul‐16 Aug‐16 Sep‐16 Oct‐16 Nov‐16 Dec‐16 Jan‐17 Feb‐17 Mar‐17 Apr‐17 May‐17 Jun‐17 Jul‐17 Aug‐17 Sep‐17
Motor Fuel (right axis) All Items (left axis) All Items exc Food & Energy (left axis) Shelter (left axis)
7
Source: FRED, FOMC Statement
8
0.0 0.5 1.0 1.5 2.0 2.5 3.0 3.5 4.0 4.5 2002‐Q4 2003‐Q2 2003‐Q4 2004‐Q2 2004‐Q4 2005‐Q2 2005‐Q4 2006‐Q2 2006‐Q4 2007‐Q2 2007‐Q4 2008‐Q2 2008‐Q4 2009‐Q2 2009‐Q4 2010‐Q2 2010‐Q4 2011‐Q2 2011‐Q4 2012‐Q2 2012‐Q4 2013‐Q2 2013‐Q4 2014‐Q2 2014‐Q4 2015‐Q2 2015‐Q4 2016‐Q2 2016‐Q4 2017‐Q2 2017‐Q4 2018‐Q2 2018‐Q4 2019‐Q2 2019‐Q4 $ Trllions
MBS US Treasuries Hypothetical path
10
11 FRBNY Bonis, Brian, Jane Ihrig, and Min Wei (2017). "Projected Evolution of the SOMA Portfolio and the 10-year Treasury Term Premium Effect," FEDS Notes. Washington: Board of Governors of the Federal Reserve System, September 22, 2017, https://doi.org/10.17016/2380- 7172.2081. Data: https://www.federalreserve.gov/econres/notes/feds-notes/projected-evolution-of-the-soma-portfolio-and-the-10-year-treasury-term- premium-effect-accessible-20170922.htm#fig1
13
Source: CBO
14
Source: Federal Reserve, Freddie Mac, MBA
15
Source: S&P
16
17
Source: Census, USPS, EIA
18 970 950 650 540 1,350 1,100 750 538 971 1,344 1,177 871 1,036 1,156 1,295 200 400 600 800 1,000 1,200 1,400 1,600 2014 2015 2016 2017 Thousands
Source: Adjusted CPS, MBA
19
Source: NAR, MBA
20 1000 2000 3000 4000 5000 6000 7000 8000 2 4 6 8 10 12 1999 1999 2000 2000 2001 2001 2002 2002 2003 2003 2004 2004 2005 2005 2006 2006 2007 2007 2008 2008 2009 2009 2010 2010 2011 2011 2012 2012 2013 2013 2014 2014 2015 2015 2016 2016 2017 2017 2018 2018 2019 2019 2020 2020 Thousands Months
Months supply of existing homes on market (Months, SA, left axis) Existing Home Sales (Ths., SAAR, right axis) Number of homes available for sale (Ths., SA, right axis) EHS Forecast (right axis)
Source: MBA Builder Applications Survey
21
Source: Census, MBA
22 200 400 600 800 1000 1200 1400 1600 1800 2000 2200 Thousands
Single Family Starts (SAAR) MF Starts (SAAR) Total Completions (SAAR)
Source: BLS, NAHB
23 0.0 1.0 2.0 3.0 4.0 5.0 6.0 7.0 8.0 Jan‐02 Sep‐02 May‐03 Jan‐04 Sep‐04 May‐05 Jan‐06 Sep‐06 May‐07 Jan‐08 Sep‐08 May‐09 Jan‐10 Sep‐10 May‐11 Jan‐12 Sep‐12 May‐13 Jan‐14 Sep‐14 May‐15 Jan‐16 Sep‐16 May‐17
Layoffs and Discharges Rate (12 mo. moving avg., %) Hires Rate (12 mo. moving avg., %) Job Openings Rate (12 mo. moving avg., %)
Source: FHFA, BLS
24 2.3% 6.4% 2.4% ‐10.0% ‐5.0% 0.0% 5.0% 10.0% 15.0% Q1‐83 Q1‐85 Q1‐87 Q1‐89 Q1‐91 Q1‐93 Q1‐95 Q1‐97 Q1‐99 Q1‐01 Q1‐03 Q1‐05 Q1‐07 Q1‐09 Q1‐11 Q1‐13 Q1‐15 Q1‐17 Q1‐19
ECI: Wages & Salaries: Civilian Workers (SA, Dec‐05=100) FHFA House Price Index, United States (NSA, Q1‐80=100)
25
26