
SLIDE 1
18TH INTERNATIONAL CONFERENCE ON COMPOSITE MATERIALS
- Table1. Elastic and strength properties of uniaxial
carbon/epoxy test coupons
[0]6 [90]16 [+/-45]2S E1 (GPa) SL
(+)
(GPa) E2 (GPa) ST
(+)
(MPa) G12 (GPa) SLT (MPa) 138 2.30 9.33 43.4 4.56 91.9
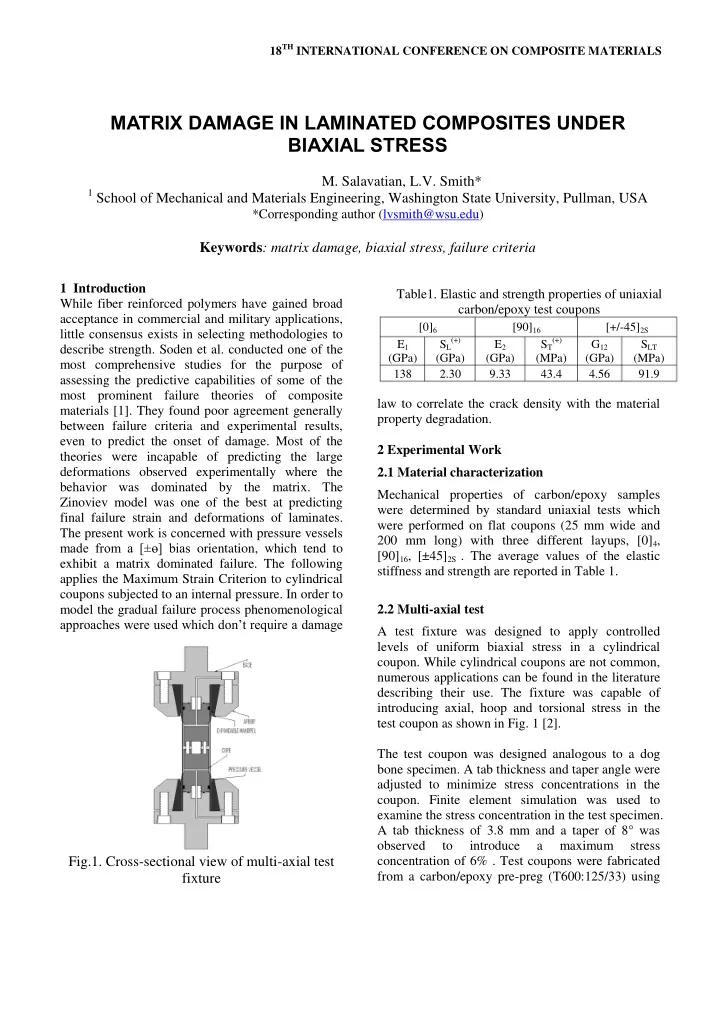
1 Introduction While fiber reinforced polymers have gained broad acceptance in commercial and military applications, little consensus exists in selecting methodologies to describe strength. Soden et al. conducted one of the most comprehensive studies for the purpose of assessing the predictive capabilities of some of the most prominent failure theories of composite materials [1]. They found poor agreement generally between failure criteria and experimental results, even to predict the onset of damage. Most of the theories were incapable of predicting the large deformations observed experimentally where the behavior was dominated by the matrix. The Zinoviev model was one of the best at predicting final failure strain and deformations of laminates. The present work is concerned with pressure vessels made from a [±ө] bias orientation, which tend to exhibit a matrix dominated failure. The following applies the Maximum Strain Criterion to cylindrical coupons subjected to an internal pressure. In order to model the gradual failure process phenomenological approaches were used which don’t require a damage law to correlate the crack density with the material property degradation. 2 Experimental Work 2.1 Material characterization Mechanical properties of carbon/epoxy samples were determined by standard uniaxial tests which were performed on flat coupons (25 mm wide and 200 mm long) with three different layups, [0]4, [90]16, [±45]2S . The average values of the elastic stiffness and strength are reported in Table 1. 2.2 Multi-axial test A test fixture was designed to apply controlled levels of uniform biaxial stress in a cylindrical
- coupon. While cylindrical coupons are not common,
numerous applications can be found in the literature describing their use. The fixture was capable of introducing axial, hoop and torsional stress in the test coupon as shown in Fig. 1 [2]. The test coupon was designed analogous to a dog bone specimen. A tab thickness and taper angle were adjusted to minimize stress concentrations in the
- coupon. Finite element simulation was used to
examine the stress concentration in the test specimen. A tab thickness of 3.8 mm and a taper of 8° was
- bserved
to introduce a maximum stress concentration of 6% . Test coupons were fabricated from a carbon/epoxy pre-preg (T600:125/33) using
Fig.1. Cross-sectional view of multi-axial test fixture
MATRIX DAMAGE IN LAMINATED COMPOSITES UNDER BIAXIAL STRESS
- M. Salavatian, L.V. Smith*