
SLIDE 1
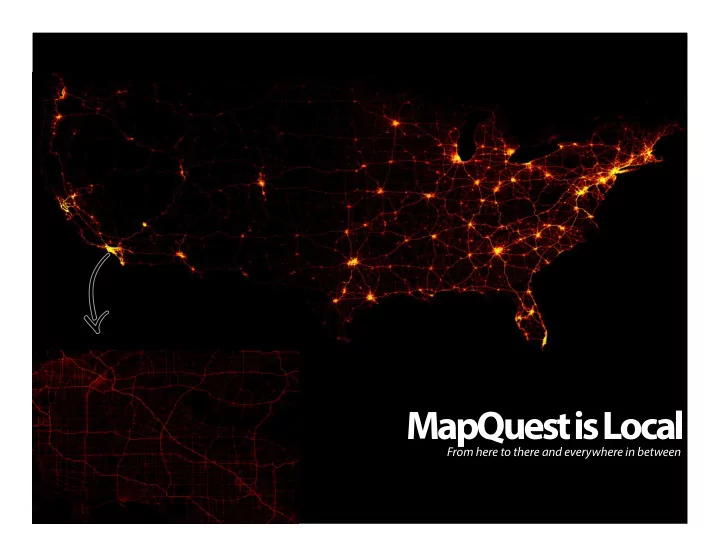
MapQuest is Local
From here to there and everywhere in between
MapQuest is Local From here to there and everywhere in between WHOS - - PowerPoint PPT Presentation
MapQuest is Local From here to there and everywhere in between WHOS MAPQUESTING IT: WOMEN, LOCAL, TRAVEL 40 MULTI-PLATFORM UVs 2B MILLION ROUTES USERS ANNUALLY 25M+ 30% APP DOWNLOADS 57% 43% > 50mi # 2 70% 44% MOMS < 50mi
From here to there and everywhere in between
2
70% 30%
< 50mi
> 50mi
MULTI-PLATFORM UV’s 2B
44% MOMS eAddressables
34% HHI > $100K
$75K+
HHI
Source: ComScore, MapQuest Internal Data
APP DOWNLOADS
MAPPING PROVIDER
45% OF LOCAL ROUTES UNDER 50
MILES END AT A POI
MORE LIKELY TO PURCHASE
2.3x ONLINE 2.6x OFFLINE
(VS. AVERAGE INTERNET USER)
Monthly Spend
3
100 131 163 152 171 176 180 177 147 149 146 145 168 153 168 179 156
Composition Index – MapQuest Users’ Behavior vs. Average Internet User
Source: ComScore Media Metrix Cross-Visitation; *Social Networks is based aver comp index for FB, Twitter, and LinkedIn
4
Source: MapQuest Internal Data, ComScore
OF LOCAL ROUTES ARE TO A POI 2 3 5 5 6 6 7 8 11 11 12 13 15 16 17 24 30 34 38 40 45
Beauty & Health Retailer Wedding Funeral Services Managed Care Sports Auto Home Improvement Entertainment Pharmacy/Grocery/Convience Business Golf Finance Auto Related Real Estate Travel Hotels & Motels Retail Health / Pharma Restaurants Tourist Attractions Educational
5
Source: ComScore Purchase Study
BUYER COMPOSITION INDEX (VS. AVERAGE INTERNET USER) OFFLINE PURCHASE BEHAVIOR
167 176 184 216 225 254 256 265 269 272 285 285 285 292 304 307 326 332 370 410 234 Apparel & Accessories Sporting Goods Consumer Electronics Service & Parts Coffee Shops Telecommunication Services Fast Food Movies & DVDs Gas & Convenience Home Furnishings Superstores Groceries Restaurants Drug Stores Department Stores Home Improvement Beauty Supplies & Services Pet Food & Supplies Wholesale Clubs Event Tickets (Online Only) Total
6
With 3.6MM App & 10.9MM Mobile Web Users, we are collecting location data every sec (350-600MM data points per day) – this includes lat/long, speed, bearing and altitude
USA Chicago Manhattan Philadelphia Washington DC Atlanta Los Angeles
Sources: comScore Mobile Metrix June 2014, MapQuest GPS data
7
Sources: MapQuest Internal Data
Able to target various POIs (like McDonald’s) utilizing MapQuest ~19MM POI Database
8
19% 39% 48% 64% 76% 86% 91% 96%
% of Total Daily Avg. Daily UVs in the Vicinity of a McDonald’s
Advertisers can leverage user behavior across searches, routes, and GPS location
266.8 114.2 74.1 Broad Refined Exact Search KW Terms - McDonald's (000s) 285.1 112.4 100.2 497.8 End Start Via Total Routes associated w/ McDonald’s (000s) 23.9 17.3 10.7 Restuarants QSRs McDonalds Search Queries by Result Type (MMs)
Leverage GPS Data
Restaurants
Sources: comScore, MapQuest Internal Data, MapQuest GPS data