
SLIDE 1
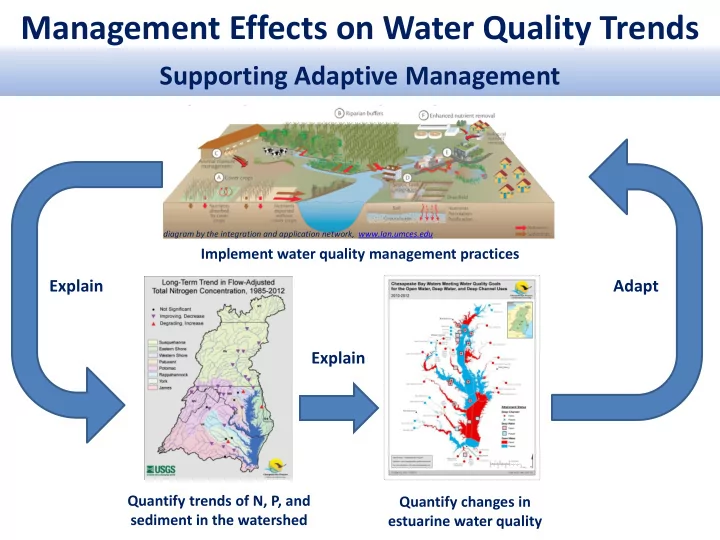
Management Effects on Water Quality Trends
Supporting Adaptive Management
Quantify trends of N, P, and sediment in the watershed Quantify changes in estuarine water quality Implement water quality management practices
Explain Explain Adapt
diagram by the integration and application network, www.Ian.umces.edu