
SLIDE 1
MALONE
Commercial & Investment Real Estate
MALONE Commercial & Investment Real Estate 2011 Office Market - - PowerPoint PPT Presentation
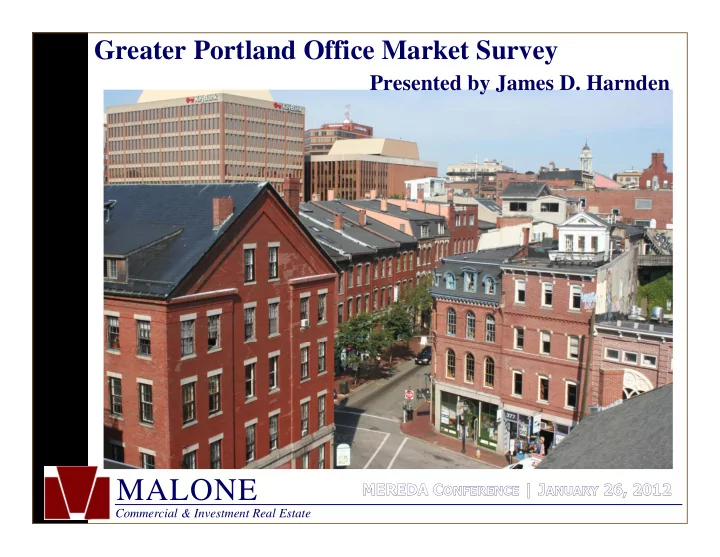
Greater Portland Office Market Survey Presented by James D. Harnden MALONE Commercial & Investment Real Estate 2011 Office Market Highlights Overall vacancy rate up only .27% - worst is over 90,000 sq. ft. of positive net absorption
Commercial & Investment Real Estate
Commercial & Investment Real Estate
GREATER PORTLAND OFFI CE MARKET SURVEY
Commercial & Investment Real Estate
235,129 23,675 232,775 216,680 106,589 (1,878) 32,194 (51,959) (257,867) 89,076 6.05% 6.97% 7.44% 7.21% 5.15% 7.15% 8.59% 10.39% 12.65% 12.92% 0% 2% 4% 6% 8% 10% 12% 14%
100,000 200,000 300,000
Net Absorption (S.F.) Overall Vacancy Does not include information regarding Greater Portland's medical space
GREATER PORTLAND OFFI CE MARKET SURVEY
Commercial & Investment Real Estate
Does not include information regarding Greater Portland's medical space
6.38 3.53 6.41 6.41 7.50 4.90 4.87 7.88 11.36 15.20 7.35 12.08 11.24 7.79 6.48 9.94 11.55 9.39 17.60 17.32 6.98 8.88 9.40 7.27 6.86 8.09 8.99 8.82 15.27 16.54 1 3 5 7 9 11 13 15 17 19
1 2 3 4 5 6 7 8 9 10
Downtown A Downtown B TOTAL
2002 2007 2006 2005 2004 2003 2008 2009 2010 2011 P E R C E N T
GREATER PORTLAND OFFI CE MARKET SURVEY
Commercial & Investment Real Estate
♦
♦
♦
♦
44,124 SF
GREATER PORTLAND OFFI CE MARKET SURVEY
♦
♦
♦
♦
♦
♦
Commercial & Investment Real Estate
Does not include information regarding Greater Portland's medical space
3.98 3.14 6.16 10.33 2.36 6.63 7.78 12.85 9.66 9.94 6.40 7.19 5.30 4.14 4.98 6.08 8.68 10.76 11.00 9.56 5.23 5.27 5.72 7.16 3.69 6.35 8.25 11.74 10.37 9.74
1 3 5 7 9 11 13 15 17 1 2 3 4 5 6 7 8 9 10
GREATER PORTLAND OFFI CE MARKET SURVEY
P E R C E N T 2002 2007 2006 2005 2004 2003 2008 2009 2010 2011
Suburban A Suburban B Total
▲
Commercial & Investment Real Estate
GREATER PORTLAND OFFI CE MARKET SURVEY
♦
♦
♦
♦
♦
♦
♦
♦
♦
Commercial & Investment Real Estate
8,620,268 8,815,201 9,051,689 9,136,854 9,287,786 9,492,995 9,684,467 9,769,153 9,876,142 10,003,276 $14.51 $15.02 $15.32 $15.90 $16.39 $17.63 $16.78 $17.24 $16.67 $16.95 $14 $15 $16 $17 $18 8,500,000 9,000,000 9,500,000 10,000,000 10,500,000 2002 2003 2004 2005 2006 2007 2008 2009 2010 2011
Does not include information regarding Greater Portland's medical space
GREATER PORTLAND OFFI CE MARKET SURVEY
Rentable Square Feet Average Annual Growth of 1.67% Asking Rental Rates Average Annual Growth of 1.74%
▲
Commercial & Investment Real Estate
SOURCE: Cushman & Wakefield regional information Malone Commercial Brokers local information
GREATER PORTLAND OFFI CE MARKET SURVEY
NOTE: So. New Hampshire & Hartford 2011 Vacancy is through the 3rd quarter of 2011.
10,003,276 SF 12,512,690 SF 183,147,560 SF 25,654,861 SF
Commercial & Investment Real Estate
~ 38,562 SF Class B office building ~ $1,600,000 ~ Investor sale
~ 23,000 SF Class B office building ~ $1,500,000 ~ Investor sale
~ 8,000 SF - 1st floor sold to S.P. Housing
Authority - $935,000 ~ 16,000 SF – 3rd & 4th floors sold to First Atlantic Mortgage - $1,650,000
~ 8,000 SF Class B office building
~ $1,400,000 ~ Investor sale
GREATER PORTLAND OFFI CE MARKET SURVEY
Commercial & Investment Real Estate
~ 8,000 SF Class B office building ~ $835,000 ~ Investor sale
~ 22,405 SF Class B office building ~ $3,650,000 ~ Investor sale
~ 140,000 SF Class A office building ~ Partnership sale
~ 240,000 SF Class B office building ~ $2,500,000 (note purchased)
~ Investor sale
GREATER PORTLAND OFFI CE MARKET SURVEY
Commercial & Investment Real Estate
GREATER PORTLAND OFFI CE MARKET SURVEY