
SLIDE 1
Major Outcomes 1) Joint reconnaissance efforts of building damage by - - PowerPoint PPT Presentation
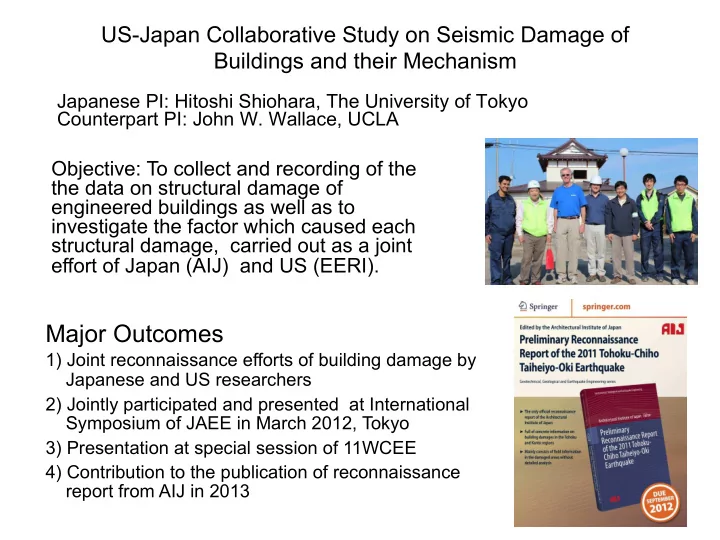
US-Japan Collaborative Study on Seismic Damage of Buildings and their Mechanism Japanese PI: Hitoshi Shiohara, The University of Tokyo Counterpart PI: John W. Wallace, UCLA Objective: To collect and recording of the the data on structural
Edited by the Architectural Institute of Japan
Geotechnical, Geological and Earthquake Engineering series
7 The only official reconnaissance
report of the Architectural Institute of Japan
7 Full of concrete information on
building damages in the Tohoku and Kanto regions
7 Mainly consists of field information
in the damaged areas without detailed analysis
D U E
S E P T E M B E R
springer.com
15 m 20 m
X Y
10-D22 10-D22 500 x 500 500 x 500 3,4-D10@100 3,4-D10@100 2,2-D10@140 2,2-D10@140 B x D Rebar Hoop Joint Bottom Section 8-D22 500 x 500 2,3-D10@100 2,2-D10@140 B x D Hoop Rebar Joint Top Section 8-D22 10-D22 500 x 500 500 x 500 2,3-D10@100 2,4-D10@100 2,2-D10@140 2,2-D10@140 2Fl. Hoop B x D Rebar Joint Section 8-D22 500 x 500 2,2-D10@100 2,2-D10@100 10-D22 500 x 500 2,2-D10@140 2,2-D10@140 4Fl. 3Fl. Hoop B x D Rebar Joint Section C2 C1 List of Column 1Fl. RFl. 4Fl. Top Bottom Stirrup Section B x D Web Location 3Fl. Top Bottom Stirrup Section B x D Web 2Fl. Top Bottom Stirrup Section B x D Web G1 4-D22 3-D22 4-D22 3-D22 3-D22 3-D22 4-D10 300 x 600 2-D10@200 Center End End 5-D22 3-D22 5-D22 3-D22 3-D22 3-D22 4-D10 300 x 600 2-D10@200 6-D22 3-D22 6-D22 3-D22 3-D22 3-D22 4-D10 300 x 600 2-D10@200 List of Girder
17
*BSL : Building Standard Law ( Prevention of column shear failure ) ( The “shin-taishin”, new standard ) ( Effectiveness of the 1981 revision was confirmed ) ( Performance based criteria introduced ) ( To urge building owners to retrofit existing vulnerable buildings )
Izumi ward Miyagino ward Wakabayashi ward Taihaku ward Aoba ward JR Sendai Station Port of Sendai Pacific Ocean Site of the building City of Sendai
X1 X2 X3 X4 X5 X6 X7 X8 X0 Y1 Y2 Y3 Y4 Y0 Y5
V V V IV IV IVs III III IVs V Vs IIIs III IIIs IIIs III III IIIs IIIs IIIs III IIs II IIs IIs IIs IIs II II II II IIs IIs II Is Is Is Is I I Is Is Is Is I I O O O O O O O O O O O O O O
see Fig. 7 Entrance
west east south north
Municipal offices Medical Service
Y1 Y2 Y3 Y4 Y0 Y5 X1 X2 X3 X4 X5 X6 X7 X8 X0
III III IIIs III II II II IIs IIs IIs I I I Is Is Vs I I Is I I Is I I Is I I I Is Is Is Is Is Is Is I I I I I O O O O O O O O O O O O O O O O O O O O O O west east south north
Municipal offices
Y1 Y2 Y3 Y4 Y0 Y5 X1 X2 X3 X4 X5 X6 X7 X8 X0
III III IIIs III II II II IIs IIs IIs I I I Is Is Vs I I Is I I Is I I Is I I I Is Is Is Is Is Is Is I I I I I O O O O O O O O O O O O O O O O O O O O O O
Y1 X1 X2 X3 X4 X5 X6 X7 X8 Y2 Y3 Y4
Is Is IIs IIs IIIs IVs IVs IVs IVs Is Is Is Is Is west east south north
Apartment units Corridor RC non-structural partition
X8 X7 X6 X5 X4 X3 X0 X2 X1
1FL GL 2FL 3FL 4FL 5FL 6FL 7FL 8FL 9FL RFL PHRFL 36,150 4,100 7,400 10,150 12,850 15,550 18,150 20,750 23,350 26,150 500 5 400 8 = 43 200 IVs IVs IVs IVs IVs IVs shear crack on beam-column joint Is O O O O O O O IIs Is Is I I I I IIs II II III Is II
Unit in mm
see Fig. 10 Shear failure of columns Latice steel
steel shape in concrete O IIIs
Y0 Y1 Y2 Y3 Y4 Y5
4 500 4 500 6 000 6 000 6 000 O III II O I Is Is Is IIs III III III O III IV V V
unit in mm
see Fig. 7
shear cracks on coupling beams
steel shape in concrete O IIIs
Y0 Y1 Y2 Y3 Y4 Y5
4 500 4 500 6 000 6 000 6 000 O III II O I Is Is Is IIs III III III O III IV V V
unit in mm
see Fig. 7
flexural failure and buckling of rebars at the bottom of column
Seismic Evaluation Standards by JBDPA
no good correlation good correlation
10-D19 hoop φ9@250 750 450 450 220 220 1150 horizontal section
vertical section
4-D19 3-D19
4-D22+6-D19 hoop φ9@250 750 600 600 220 220 1250 unit in mm horizontal section
vertical section
4-D22 4-D22
Shear failur Shear failure in kN Shear failure Flexural hinge in kN Flexural hinge in kN Flexural hinge Column-to-beam strength ratio Column-to-beam ength ratio Joint shear strength column beam joint column case 1* column case 2* beam case 1 case 2 strength margin*
Tributary area of gravity load Column Wall floor plan
37
Δ P V
Collapse mechanism by Joint hinging Subsequent repetition due to Cyclic loading
columns.
Collapsed Structure : Wencheuan Earthquake (2008)
P
Skeleton curve P-delta Effect Slip
38
39
rigid panel rigid panel steel element bond link bond link steel element concrete spring concrete element concrete element steel element steel element axial stiffness is factored considering pull-out of bars from member end diagonal concrete horizontal reinforcing bars vertical reinforcing bars vertical & horizontal concrete A A' {A'}={A} macro element of beam-column joint force-based beam-column element node
superimpose
P-Delta effect is incorporated to stiffness matrix
ft
0.25ft
t1
Tension Compression Modified Kent & Park
1.5y y
Es Es Es/4
steel
Tension Compression Modified Bi-linear
s s1s2s3 s4 s5
2 3
bond-slip
Modified Eligehausen
40
50 100
2 4 -4
2 4
Db/Dc=1 Mcu/Mbu=1.0 Vju/Vu=1.03
B02
50 100
2 4 -4
2 4
Db/Dc=1 Mcu/Mbu=1.35 Vju/Vu=1.03
B05
Db/Dc=0.5 Mcu/Mbu=1.03 Vju/Vu=1.06
D05
Db/Dc=1 Mcu/Mbu=2.06 Vju/Vu=1.63
H01
41
42
with non-linear BC Joint model with elastic BC Joint model
43
Mcu/Mbu=1.0 Mcu/Mbu=1.5 Mcu/Mbu=1.5 Mcu/Mbu=1.0 0.05 0.1 0.1 0.2 0.3 0.4 0.05 0.1 0.05 0.1 0.5 1.0 1.5 2.0 2.5 3.0 Sa(T1=0.46s,5%), g
EQ 1.0
0.05 0.1 1.0 2.0 3.0 4.0 5.0 6.0 Sa(T1=0.46s,5%), g 0.05 0.1 0.1 0.2 0.3 0.4 0.5 0.6 0.7 Sa(T1=0.46s,5%), g 0.5 1.0 1.5 2.0 2.5 Sa(T1=0.46s,5%), g
EQ 1.0 EQ 1.0 EQ 1.0
JMA Kobe JR Takatori SCT1 story drift in rad
0.05 0.1 0.15 0.5 1.0 1.5 2.0 2.5 3.0 Sa(T1=0.46s,5%), g
EQ 1.0
0.05 0.1 0.15
Mcu/Mbu=1.0 Mcu/Mbu=1.1 Mcu/Mbu=1.2 Mcu/Mbu=1.3 Mcu/Mbu=1.4 Mcu/Mbu=1.5 Mcu/Mbu=1.0 Mcu/Mbu=1.1 Mcu/Mbu=1.2 Mcu/Mbu=1.3 Mcu/Mbu=1.4 Mcu/Mbu=1.5 Mcu/Mbu=1.0 Mcu/Mbu=1.1 Mcu/Mbu=1.2 Mcu/Mbu=1.3 Mcu/Mbu=1.4 Mcu/Mbu=1.5
0.05 0.1 0.15 1.0 2.0 3.0 4.0 5.0 6.0 Sa(T1=0.46s,5%), g 0.05 0.1 0.15 0.05 0.1 0.15 0.1 0.2 0.3 0.4 0.5 0.6 0.7 Sa(T1=0.46s,5%), g 0.05 0.1 0.15 0.05 0.1 0.15 0.5 1.0 1.5 2.0 2.5 Sa(T1=0.46s,5%), g
EQ 1.0 EQ 1.0 EQ 1.0 Mcu/Mbu=1.0 Mcu/Mbu=1.1 Mcu/Mbu=1.2 Mcu/Mbu=1.3 Mcu/Mbu=1.4 Mcu/Mbu=1.5
45
46