Machine Learning 10-701 Tom M. Mitchell Machine Learning Department - - PDF document

machine learning 10 701
SMART_READER_LITE
LIVE PREVIEW

Machine Learning 10-701 Tom M. Mitchell Machine Learning Department - - PDF document

Machine Learning 10-701 Tom M. Mitchell Machine Learning Department Carnegie Mellon University February 22, 2011 Today: Readings: Recommended: Clustering Jordan Graphical Models Mixture model clustering Muphy Intro


slide-1
SLIDE 1

1

Machine Learning 10-701

Tom M. Mitchell Machine Learning Department Carnegie Mellon University February 22, 2011

Today:

  • Clustering
  • Mixture model clustering
  • Learning Bayes Net

structure

  • Chow-Liu for trees

Readings:

Recommended:

  • Jordan “Graphical Models”
  • Muphy “Intro to Graphical

Models”

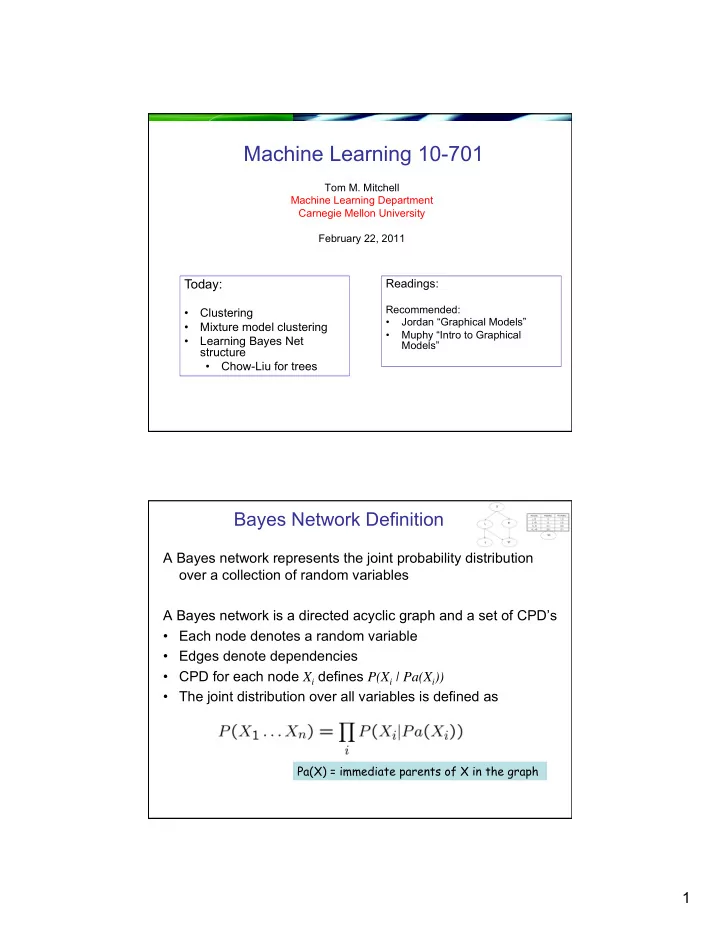
Bayes Network Definition

A Bayes network represents the joint probability distribution

  • ver a collection of random variables

A Bayes network is a directed acyclic graph and a set of CPD’s

  • Each node denotes a random variable
  • Edges denote dependencies
  • CPD for each node Xi defines P(Xi | Pa(Xi))
  • The joint distribution over all variables is defined as

Pa(X) = immediate parents of X in the graph

slide-2
SLIDE 2

2

Usupervised clustering Just extreme case for EM with zero labeled examples… Clustering

  • Given set of data points, group them
  • Unsupervised learning
  • Which patients are similar? (or which earthquakes,

customers, faces, web pages, …)

slide-3
SLIDE 3

3

Mixture Distributions

Model joint as mixture of multiple distributions. Use discrete-valued random variable Z to indicate which distribution is being use for each random draw So Mixture of Gaussians:

  • Assume each data point X=<X1, … Xn> is generated by
  • ne of several Gaussians, as follows:
  • 1. randomly choose Gaussian i, according to P(Z=i)
  • 2. randomly generate a data point <x1,x2 .. xn> according

to N(µi, Σi)

EM for Mixture of Gaussian Clustering

Let’s simplify to make this easier: 1. assume X=<X1 ... Xn>, and the Xi are conditionally independent given Z. 2. assume only 2 clusters (values of Z), and 3. Assume σ known, π1 … πK, µ1i …µKi unknown Observed: X=<X1 ... Xn> Unobserved: Z

Z X1 X4 X3 X2

slide-4
SLIDE 4

4

EM

Given observed variables X, unobserved Z Define where Iterate until convergence:

  • E Step: Calculate P(Z(n)|X(n),θ) for each example X(n).

Use this to construct

  • M Step: Replace current θ by

Z X1 X4 X3 X2

EM – E Step

Calculate P(Z(n)|X(n),θ) for each observed example X(n) X(n)=<x1(n), x2(n), … xT(n)>.

Z X1 X4 X3 X2

slide-5
SLIDE 5

5

EM – M Step

Z X1 X4 X3 X2

First consider update for π

π’ has no influence

EM – M Step

Z X1 X4 X3 X2

Now consider update for µji

µji’ has no influence

… … … Compare above to MLE if Z were

  • bservable:
slide-6
SLIDE 6

6

EM – putting it together

Given observed variables X, unobserved Z Define where Iterate until convergence:

  • E Step: For each observed example X(n), calculate P(Z(n)|X(n),θ)
  • M Step: Update

Z X1 X4 X3 X2

Mixture of Gaussians applet

Go to: http://www.socr.ucla.edu/htmls/SOCR_Charts.html then go to Go to “Line Charts”  SOCR EM Mixture Chart

  • try it with 2 Gaussian mixture components (“kernels”)
  • try it with 4
slide-7
SLIDE 7

7

  • For learning from partly unobserved data
  • MLEst of θ =
  • EM estimate: θ =

Where X is observed part of data, Z is unobserved

  • EM for training Bayes networks
  • Can also develop MAP version of EM
  • Can also derive your own EM algorithm for your own

problem

– write out expression for – E step: for each training example Xk, calculate P(Zk | Xk, θ) – M step: chose new θ to maximize

What you should know about EM Learning Bayes Net Structure

slide-8
SLIDE 8

8

How can we learn Bayes Net graph structure?

In general case, open problem

  • can require lots of data (else high risk of overfitting)
  • can use Bayesian methods to constrain search

One key result:

  • Chow-Liu algorithm: finds “best” tree-structured network
  • What’s best?

– suppose P(X) is true distribution, T(X) is our tree-structured network, where X = <X1, … Xn> – Chou-Liu minimizes Kullback-Leibler divergence:

slide-9
SLIDE 9

9

Chow-Liu Algorithm

Key result: To minimize KL(P || T), it suffices to find the tree network T that maximizes the sum of mutual informations

  • ver its edges

Mutual information for an edge between variable A and B: This works because for tree networks with nodes

Chow-Liu Algorithm

  • 1. for each pair of vars A,B, use data to estimate P(A,B),

P(A), P(B)

  • 2. for each pair of vars A,B calculate mutual information
  • 3. calculate the maximum spanning tree over the set of

variables, using edge weights I(A,B)

(given N vars, this costs only O(N2) time)

  • 4. add arrows to edges to form a directed-acyclic graph
  • 5. learn the CPD’s for this graph
slide-10
SLIDE 10

10

1/ 1/ 1/ 1/ 1/ 1/ 1/ 1/ 1/ 1/ 1/

[courtesy A. Singh, C. Guestrin]

Bayes Nets – What You Should Know

  • Representation

– Bayes nets represent joint distribution as a DAG + Conditional Distributions – D-separation lets us decode conditional independence assumptions

  • Inference

– NP-hard in general – For some graphs, closed form inference is feasible – Approximate methods too, e.g., Monte Carlo methods, …

  • Learning

– Easy for known graph, fully observed data (MLE’s, MAP est.) – EM for partly observed data – Learning graph structure: Chow-Liu for tree-structured networks