Machine Learning 10-701 Tom M. Mitchell Machine Learning Department - - PDF document

machine learning 10 701
SMART_READER_LITE
LIVE PREVIEW

Machine Learning 10-701 Tom M. Mitchell Machine Learning Department - - PDF document

Machine Learning 10-701 Tom M. Mitchell Machine Learning Department Carnegie Mellon University March 31, 2011 Today: Readings: Learning representations III Deep Belief Networks ICA CCA Neuroscience example Latent


slide-1
SLIDE 1

1

Machine Learning 10-701

Tom M. Mitchell Machine Learning Department Carnegie Mellon University March 31, 2011

Today: Learning representations III

  • Deep Belief Networks
  • ICA
  • CCA
  • Neuroscience example
  • Latent Dirichlet Allocation

Readings:

  • Deep Belief Networks
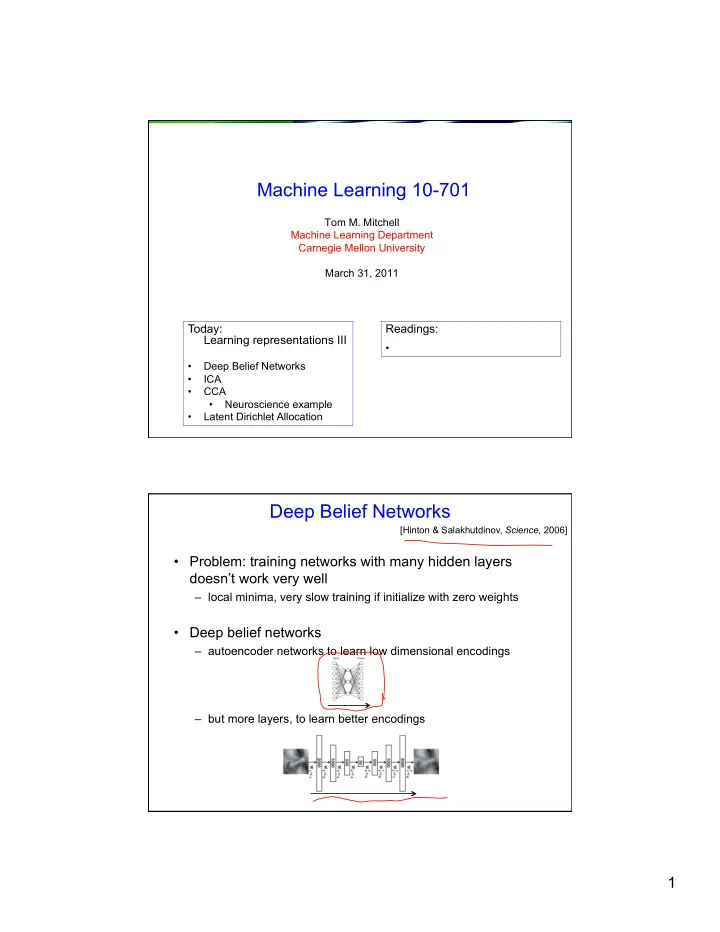
  • Problem: training networks with many hidden layers

doesn’t work very well

– local minima, very slow training if initialize with zero weights

  • Deep belief networks

– autoencoder networks to learn low dimensional encodings – but more layers, to learn better encodings

[Hinton & Salakhutdinov, Science, 2006]

slide-2
SLIDE 2

2

  • riginal image

reconstructed from 2000-1000-500-30 DBN reconstructed from 2000-300, linear PCA [Hinton & Salakhutdinov, 2006]

Deep Belief Networks

versus

logistic transformations linear transformations

Encoding of digit images in two dimensions

784-2 linear encoding (PCA) 784-1000-500-250-2 DBNet

[Hinton & Salakhutdinov, 2006]

slide-3
SLIDE 3

3

Restricted Boltzman Machine

  • Bipartite graph, logistic activation
  • Inference: fill in any nodes, estimate other nodes
  • consider vi, hj are boolean variables

v1 v2 vn … h1 h2 h3

Deep Belief Networks: Training

[Hinton & Salakhutdinov, 2006]

slide-4
SLIDE 4

4

Independent Components Analysis (ICA)

  • PCA seeks orthogonal directions <Y1 … YM> in feature

space X that minimize reconstruction error

  • ICA seeks directions <Y1 … YM> that are most statistically
  • independent. I.e., that minimize I(Y), the mutual

information between the Yj :

x x

Dimensionality reduction across multiple datasets

  • Given data sets A and B, find linear projections of each

into a common lower dimensional space!

– Generalized SVD: minimize sq reconstruction errors of both – Canonical correlation analysis: maximize correlation of A and B in the projected space data
set
A
 data
set
B
 learned
shared
representation


slide-5
SLIDE 5

5

[slide courtesy of Indra Rustandi]

An Example Use of CCA

Generative
theory Generative
theory


of
word
 representation
 arbitrary
word
 predicted
brain
 activity


slide-6
SLIDE 6

6

fMRI activation for “bottle”: Mean activation averaged over 60 different stimuli: “bottle” minus mean activation:

fMRI activation

high below average average bottle

Idea: Predict neural activity from corpus statistics of stimulus word

Generative
theory Generative
theory
 predicted
activity
 for
“telephone”
 “telephone” Statistical
features
 from
a
trillion-word
 text
corpus
 Mapping
learned
 from
fMRI
data


[Mitchell
et
al.,
Science,
2008]


slide-7
SLIDE 7

7

Semantic feature values: “celery” 0.8368, eat 0.3461, taste 0.3153, fill 0.2430, see 0.1145, clean 0.0600, open 0.0586, smell 0.0286, touch … … 0.0000, drive 0.0000, wear 0.0000, lift 0.0000, break 0.0000, ride Semantic feature values: “airplane”

0.8673, ride

0.2891, see 0.2851, say 0.1689, near 0.1228, open 0.0883, hear 0.0771, run 0.0749, lift … … 0.0049, smell 0.0010, wear 0.0000, taste 0.0000, rub 0.0000, manipulate

Predicted Activation is Sum of Feature Contributions

Predicted Celery = + 0.35 0.84 Predicted “Celery” “eat” “taste” + 0.32 + … “fill”

high low

c14382,eat

learned

feat(celery)

from corpus statistics 500,000 learned parameters

slide-8
SLIDE 8

8

“celery” “airplane” Predicted: Observed:

fMRI activation

high below average average

Predicted and observed fMRI images for “celery” and “airplane” after training on 58 other words.

Evaluating the Computational Model

  • Train it using 58 of the 60 word stimuli
  • Apply it to predict fMRI images for other 2 words
  • Test: show it the observed images for the 2 held-out,

and make it predict which is which

1770 test pairs in leave-2-out: – Random guessing  0.50 accuracy – Accuracy above 0.61 is significant (p<0.05)

celery? airplane?

slide-9
SLIDE 9

9

Q4: What are the actual semantic primitives from which neural encodings are composed?

predicted
neural
 representation


word 25
verb

 co-occurrence
 counts??!?
 verb co-

  • ccurrence

features

predict neural representation

Alternative semantic feature sets

PREDEFINED corpus features Mean Acc. 25 verb co-occurrences .79 486 verb co-occurrences .79 50,000 word co-occurences .76 300 Latent Semantic Analysis features .73 50 corpus features from Collobert&Weston ICML08 .78 218 features collected using Mechanical Turk* .83 20 features discovered from the data** .87

* developed by Dean Pommerleau ** developed by Indra Rustandi

slide-10
SLIDE 10

10

Discovering shared semantic basis

word w learned*


 intermediate
semantic
 features


subj
1,
word+pict


predict representation

subj
9,
word+pict


predict representation

subj
10,
word
only


predict representation

subj
20,
word
only


predict representation

… … … …

218
base

 features
 20
learned

 latent
 features


… …

[Rustandi
et
al.,
2009] *
trained
using
Canonical
Correlation
Analysis

independent
of
study/subject
 specific
to
study/subject


Multi-study (WP+WO) Multi-subject (9+11) CCA Top Stimulus Words

component 1 component 2 component 3 component 4 most active stimuli apartment church closet house barn screwdriver pliers refrigerator knife hammer telephone butterfly bicycle beetle dog pants dress glass coat chair

shelter? manipulation? things that touch me?

slide-11
SLIDE 11

11

Subject 1 (Word-Picture stimuli) Multi-study (WP+WO) Multi-subject (9+11) CCA Component 1 Subject 1 (Word-ONLY stimuli) Multi-study (WP+WO) Multi-subject (9+11) CCA Component 1