m -RS was performed on gingival crevicular fluid (GCF). The fluid - - PowerPoint PPT Presentation

m rs was performed on gingival crevicular fluid
SMART_READER_LITE
LIVE PREVIEW

m -RS was performed on gingival crevicular fluid (GCF). The fluid - - PowerPoint PPT Presentation

Micro-Raman Spectroscopy for Assessment of Periodontal Disease Follow-Up Micro-Raman spectroscopy for assessment of periodontal disease follow-up Carlo Camerlingo 1 , Fabrizia dApuzzo 2 , Vincenzo Grassia 2 , Letizia Perillo 2 , Maria Lepore 3 1


slide-1
SLIDE 1

Micro-Raman Spectroscopy for Assessment of Periodontal Disease Follow-Up

Micro-Raman spectroscopy for assessment of periodontal disease follow-up

Carlo Camerlingo1, Fabrizia d’Apuzzo2, Vincenzo Grassia2, Letizia Perillo2 , Maria Lepore3

1CNR-SPIN, Istituto superconduttori, materiali innovativi e dispositivi, Pozzuoli, Italy; 2.Dipt. multidisc. Spec.medico-chirurgiche e odontoiatriche, Seconda Università di Napoli, Napoli, Italy; 3.Dipt. di Medicina Sperimentale, Seconda Università di Napoli, Napoli, Italy;

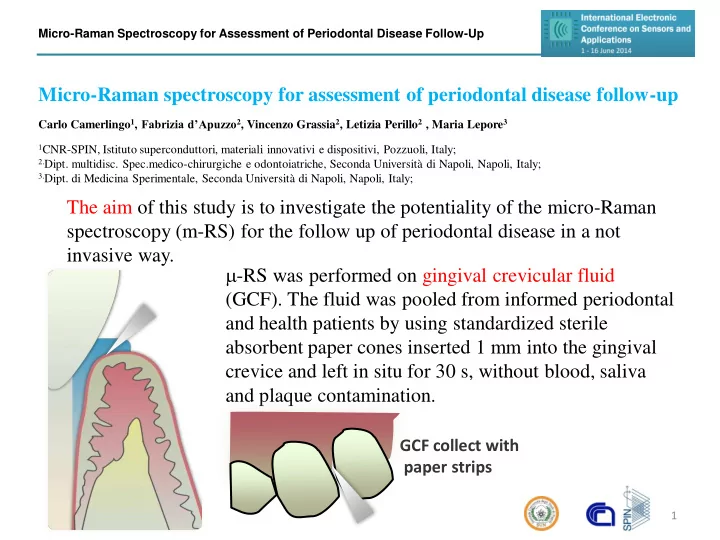
The aim of this study is to investigate the potentiality of the micro-Raman spectroscopy (m-RS) for the follow up of periodontal disease in a not invasive way.

1

m-RS was performed on gingival crevicular fluid (GCF). The fluid was pooled from informed periodontal and health patients by using standardized sterile absorbent paper cones inserted 1 mm into the gingival crevice and left in situ for 30 s, without blood, saliva and plaque contamination.

GCF collect with paper strips

slide-2
SLIDE 2

Micro-Raman Spectroscopy for Assessment of Periodontal Disease Follow-Up 2

Micro-Raman spectroscopy

He-Ne laser Moving holder PC acquisition LN2 cooled CCD Jobin Yvon TRIAX 180 monocromator 100x

  • bjective

Schematic view of experimental set up The sample is excited by a He-Ne laser operating at a light wavelength l = 633 nm, with a maximum nominal power of 17 mW. The signal is collected by a Jobin-Yvon TriAx 180 monocromator, equipped with a liquid N2 cooled CCD and a grating

  • f 1800 grooves/mm, allowing a

spectral resolution of 4 cm-1. The laser light is focused on the sample surface by means of a 100 x (n.a. 0.90)

  • ptical
  • bjective
  • n

a excitation area of about 10 mm of size. The spectra were obtained using accumulation times ranging in 60- 300 seconds. sample

slide-3
SLIDE 3

Micro-Raman Spectroscopy for Assessment of Periodontal Disease Follow-Up 3 The spectra typically show a smeared background signal, with intensity of order of about 80% of the whole average intensity. In

  • rder to enhance signal readability

and attenuate background and noise components we use a numerical data treatment based on wavelet algorithm [1]. The spectrum signal is cut up into different ‘scale’ components, by using spatially localized functions with average zero value (namely wavelets, small waves) instead of conventional Fourier transform sinusoidal functions.

1200 1400 1600 1800

  • 200
  • 100

100 200 300 400 1200 1400 1600 1800 2000 12000 14000 16000 18000 20000 22000

140000 160000 180000 200000 220000 240000
  • 2000
  • 1000
1000 2000 3000 4000
  • 1000
  • 500
500 1000 1500
  • 600
  • 400
  • 200
200 400 600
  • 1500
  • 1000
  • 500
500 1000
  • 300
  • 200
  • 100
100 200 300 400
  • 300
  • 200
  • 100
100 200
  • 200
  • 150
  • 100
  • 50
50 100 150 200
  • 150
  • 100
  • 50
50 100 150

IDWT DWT

This make possible to keep information on both frequency and spatial dependence of the signal. Basically the signal is represented in terms of the sum of elementary wavelets and decomposed in two signals, one containing the low frequency components (approximation A) and the other one the fluctuations (detail D). The algorithm is iteratively applied to the “approximated” part of the function and a higher level of A and D component pair is generated. A hierarchical representation of the data set is thus obtained allowing a multi-resolution analysis, know as discrete wavelet transform (DWT). Starting from the decomposed signal, the spectrum can be reconstructed (IDWT) removing low and high frequency components due to spurious background and non-correlated noise signal respectively. MATLAB 6.5 program (by MathWorks Inc.) was used for wavelet analysis with wavelet family of biorthogonal functions “bior6.8” . [1] Camerlingo, C.; Zenone F.; Gaeta G.M.; Riccio R.; Lepore M. Wavelet data processing of micro-Raman spectra of biological samples.

  • Meas. Sci. Technol. 2006 , 17, 298-303.3

.

Wavelet based numerical data treatment

slide-4
SLIDE 4

Micro-Raman Spectroscopy for Assessment of Periodontal Disease Follow-Up 4

800 1200 1600 2000 2400 2800 3200

after linear regression substrate Raman signal Raman signal

wavenumber shift (cm

  • 1)

Raman signal (arb. units) After the wavelet process the Raman signal of the substrate (paper cone) is subtracted from the raman signal of the sample by performing a linear regression of data.

slide-5
SLIDE 5

Micro-Raman Spectroscopy for Assessment of Periodontal Disease Follow-Up 5

For signal interpretation the spectra were analyzed in terms of convoluted Lorentzian shaped vibration modes. Peaks constituting the spectrum were manually selected in order to define the starting conditions for a best-fit procedure based on the Levenberg-Marquardt nonlinear least-square method to determine convolution peaks with

  • ptimized intensity, position and

width.

1200 1400 1600 1800

  • 200

200 400

1321 1449 1656

GCF39

Raman signal (arb. units) wavenumber (cm

  • 1)

Raman spectrum of GCF from a health patient. Protein contribution to spectrum are clearly evinced from the peaks at 1321 cm-1 (Amide III) , at 1449 cm-1 (CH2), at 1580 cm-1 (C-C stretching) and at 1656 cm-1 (Amide I).

slide-6
SLIDE 6

Micro-Raman Spectroscopy for Assessment of Periodontal Disease Follow-Up 6

The level of osteopontin in gingival crevicular fluid has been found to correlate with clinical measure of periodontal disease [2] Carotenoid concentration in GCF is expected to increase with the severity increase of the disease and in chronic periodontitis, with respect to healthy or gingivitis control. [2-3]

What we look for…

[2] Gonchukov, S.; Sukhinina A.; Bakhmutov D; Minaeva S. Raman Spectroscopy of saliva as perspective method for periodontitis diagnostics. Laser Phys. Lett. 2012, 9,73-77. [3] Kim, S.C.; Kim, O.-S., Kim, O.-J.; Kim, Y.-J.; Chung, H.-J. Antioxidant profile of whole saliva after scaling and root planing in periodontal disease, J Periodontal Implant Sci 2010, 40, 164-171.

slide-7
SLIDE 7

Micro-Raman Spectroscopy for Assessment of Periodontal Disease Follow-Up 7

1200 1400 1600 1800 2000 1500 1550 1600 1650 1700 1750 2600 2800 3000 3200 2700 2850 3000

(a)

Amide I CH def. Amide III

(c)

1676 1629 1655 1591

(b)

Raman signal (arb. units) wavenumber (cm

  • 1)

CH3

2878 2972 2931

(d)

Raman spectrum of GCF from healthy patient for the 1200-2000 cm-1 (a) and 2500- 3100 cm-1 wavenumber range (b). Deconvolution in Lorentzian peaks of the Amide I spectrum region (1500-1750 cm-1) (c) and CH3 region (2800-3000 cm-1) (d).

slide-8
SLIDE 8

Micro-Raman Spectroscopy for Assessment of Periodontal Disease Follow-Up 8

1500 1550 1600 1650 1700 1750 1594 1537 1624 1650 1685 Raman signal (arb. units) wavenumber shift (cm

  • 1)

Raman spectrum of GCF from patient affected by chronic periodontitis: Deconvolution in Lorentzian peaks of the Amide I spectrum region (1500-1750 cm-1). The intense peak at about 1537 cm-1 is likely due to the formation of isomerization products containing C=C groups [4] related to an increase

  • f degraded carotene in GCF.
  • 4. Noda, I.; Marcott, C.; Two-dimensional Raman (2D Raman)

correlation spectroscopy study of non-oxidative photodegradation

  • f b-carotene. J. Phys. Chem. A 2002, 106, 3371-3376.
slide-9
SLIDE 9

Micro-Raman Spectroscopy for Assessment of Periodontal Disease Follow-Up 9

Conclusions

A not invasive method based on m-RS of GCF for follow up of periodontal diseases is proposed and tested.  An automatic numerical data treatment based on wavelet algorithm was used in

  • rder to suppress the uncorrelated signal, to subtract the background signal and to

increase the quantitative readibility of the Raman signal.  An increase of degraded carotenoide content in GCF, as a mark of the inflammatory state, is inferred from the Raman spectra of chronic periodontitis affected patients.  Even if a more systematic and wide investigation is necessary to validate the proposed methods, the preliminary results confirm the big potentiality of m-RS for specific molecular fingerprinting in medical applications.