
SLIDE 1
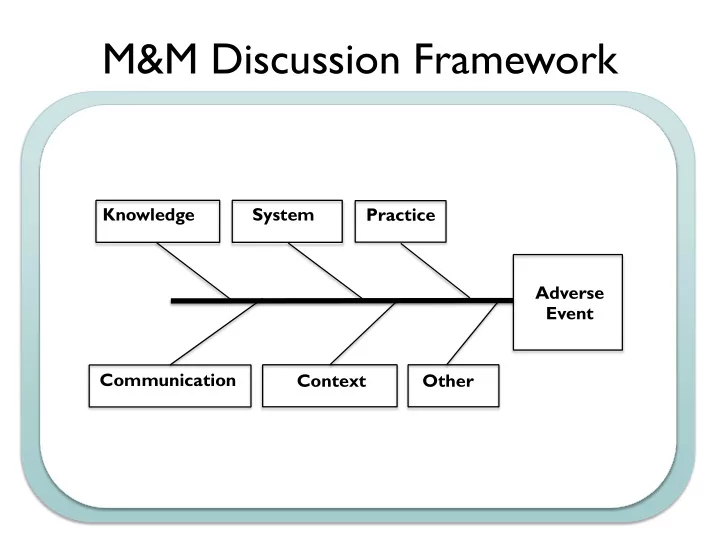
M&M Discussion Framework
Communication Context Knowledge System Practice Adverse Event Other
M&M Discussion Framework Knowledge System Practice Adverse - - PowerPoint PPT Presentation
M&M Discussion Framework Knowledge System Practice Adverse Event Communication Context Other EX: Sepsis Mortality Equipment Process People - EMR does not provide - Time to antibiotics - Staffing in ED SIRS alerts - Enough fluid
Communication Context Knowledge System Practice Adverse Event Other
Equipment Process People Materials Environment Management
SIRS alerts
source control not available 24/7
bottles
available quickly
priority
sepsis performance
collection
feedback
administration
sepsis guidelines
changes
QI Project Application Form
QI Project Application Form
Adapted for UCSF from ABP
Project Basics
expertise relevant to quality improvement.
Core Project Components
Improvement Aims
is the gap between current practice and what is possible? Why did you choose to work on this problem? Please limit response to 300 words or less.
time-specific objectives of the project. Please limit response to 300 words or less.
QI Project Application Form
Safety Timeliness Effectiveness Equity Efficiency Patient-Centered Measurement
Outcome measure (describe, include measurement and target/goal): Balancing measure (describe, including measurements if applicable): Process measure (describe, including measurement if applicable):
Monthly Quarterly Other (specify)
QI Project Application Form Interventions
should have at least two cycles of change.
how will you address the barriers? Results, Analysis, and Reporting
Individual physician level Clinic-group level Aggregated across multiple clinic-groups
Monthly Quarterly Other (specify)
charts and control charts are basic statistical process control charting methods, and the ABP strongly recommends that projects include one or both as the method of tracking results. If your project is not using run or control charts, explain why you are using an alternative format.
QI Project Application Form
aggregate data (across all participants). Comment briefly on the results. Select the QI project’s score on the Improvement Progress Scale from the table below. Explain the basis for the score. (Check one.) Improvement Progress Scale1 1.0 Design Phase Project design complete. 1.5 Baseline All participant teams formed. Baseline measurement begun. 2.0 Local adaptations Teams meeting routinely. Interventions being adapted for local factors by teams. All teams planning first tests of change (PDSAs). 2.5 Tests of change & data collection Teams have conducted first tests of change (PDSAs). All teams reporting data. No improvement in quality measures yet. 3.0 Modest process improvements All teams have conducted multiple tests of change (PDSA cycles). Process measures beginning to show improvement. 3.5 Improvement Process measures continue to improve. Some improvement in at least one outcome measure. 4.0 Significant improvement Evidence of sustained improvement in outcome measures. Halfway toward accomplishing all aims (goals). Plans for spread of improvements are formulated. 4.5 Sustainable improvement Sustained improvement in most outcome measures. 75% of aims (goals) achieved. Spread of improvements has begun. 5.0 Outstanding sustainable results All interventions implemented. All aims achieved. Improvements have spread to new settings.
1 Adapted with permission from the Institute for Healthcare Improvement’s Assessment Scale for Collaboratives at
www.ihi.org/IHI/Topics/Improvement/ImprovementMethods/Tools .
QI Project Application Form
Physician Participation
At UCSF physicians must be involved for a minimum of 6 months, with a minimum of 2 cycles of change.
implementing the intervention(s); collecting, submitting and analyzing data; participation in team meetings; and modifying the intervention(s) based on the data?
Physician Attestation Processes
Leader or by a “Local Leader”, depending on the project’s structure. This co-signing Leader is responsible for adjudicating any disputes with physicians who wish to claim credit for MOC. Because this process could affect a physician’s certification status, the co-signing Leaders should be physicians who are active participants in the approved projects. Because of the nature of the UCSF projects, Project Leaders will complete the Attestation Form and it will be co-signed by Glenn Rosenbluth as a “Local Leader”
project leadership keep key stakeholders informed of progress and results?
We did not seek IRB approval because it is not required. We did seek IRB approval because we hope to disseminate our results.
PHM QI Workshop Case: Neonatal Readmission
Summary: Term male infant admitted with fever at 2 days of age and treated for early onset GBS sepsis without complications Re-admitted at 3 weeks of age with seizure and lethargy in the setting of hypoglycemia, hyponatremia, and dehydration. Admission #1: “fever”
he developed decreased feeding frequency over 24hrs (no PO intake x 8hrs); decreased UOP (last wet diaper >18hrs ago). He has been sleepy but arousable. Rectal temp is 38.9C at home.
exclusively breastfed sibling. Recent social stressors: father lost job 1mo ago, mother has h/o postpartum depression.
IVF and antibiotics; Ampicillin and Gentamicin administered.
breastfeeding (mother could not room-in due to young sibling + distance from home).
Admission #2: “poor feeding”
breastfeeding (diminished supply, poor latch) so family started supplementing with formula (mixed w/ extra water to conserve powdered formula), cow’s milk, goat’s milk, tea, and water.
evaluation revealed hyponatremia (Na 122), hypoglycemia (glucose 40), and dehydration.
bottle.
What Happened?
Arpi Bekmezian, MD
Director of Quality and Safety, Division of Pediatric Hospital Medicine Associate Medical Director of Quality and Safety, UCSF Benioff Children’s Hospital Assistant Clinical Professor, Department of Pediatrics
Katey Hoffman, MD
Clinical Quality Liaison, UCSF-Marin General Hospital Pediatric Care Affiliation Assistant Clinical Professor, Department of Pediatrics ?? Pediatric Hospitalist, Marin General Hospital
with one day of low-grade fever, decreased UOP, lethargy.
– Prenatal: 29yo G2P1-2 mother; blood type B+, GBS-, other serologies unremarkable; uncomplicated pregnancy – Birth: NSVD @ 39wks GA; home birth with midwife attendance; Apgars 9/9; birthweight 3400gm – Postnatal: exclusively breastfeeding, difficulty maintaining latch – DOL#2-3: decreased feeding frequency over 24hrs (no PO intake x 8hrs); decreased UOP (last wet diaper >18hrs ago); infant sleepy but arousable; rectal temp 38.9C
– Family lives in Ukiah, CA
– Social stressors
– VS: T 38.7, HR 180, BP 55/25, RR 68, O2 sat: 98% – Weight: 3100gm (⇓300gm from BW) – General: Lethargic, pale, poor tone, minimally responsive to stimulation – HEENT: sunken anterior fontanel, conjunctivae clear, dry mucous membranes – CV: Tachycardia, no murmur, bounding pulses 3+, cap refill 4-5 seconds – Respiratory: tachypneic, no retractions, lungs clear – Abdomen: soft, non-distended, non-tender, no HSM – GU: nml male – Neuro: decreased tone, symmetric moro
– BCx +GBS @ 12hrs – UCx, CSF cx negative – IV antibiotics x 10 days (via umbilical line / PIV)
– MIVF x 3 days – Formula supplementation of breastfeeding – Discharge weight 3300 gm (⇓ 3% from BW)
– Mother could not room-in because 15mo sibling at home
– Appearance: lethargic, poor reactivity, dry mucous membranes – Vitals:
– Witnessed SEIZURE lasting 90 sec (tonic-clonic jerking of LUE, eye deviation)
– Electrolytes: Na 122 | Cl 94 | BUN 11 K 3.3 | HCO3 16 | Cr 0.3 – CBC: 11.1 32 Glucose 40 431 14.2
– Seizure:
– Hyponatremia:
– Hypoglycemia:
– R/o Sepsis:
– Mother reports diminished breastmilk supply after 1st hospital discharge and ongoing difficulty with latching – Family purchased powdered formula to supplement; started adding extra water to bottles last week because too expensive – Due to poor feeding, family decided to try additional bottles of cow’s milk, then goat’s milk, then tea and water
– Seizures
– Hyponatremia: corrected with IVF over 2 days – Hypoglycemia: corrected with IV dextrose – R/o Sepsis: IV abx x 48hrs; BCx, UCx, CSF Cx neg – Feeding difficulties: starts formula feeding well
– Was there a medical error? – Was the adverse event preventable?
individuals and populations increase the likelihood of desired health outcomes and are consistent with current professional knowledge.
right way, for the right person—and having the best possible results.
– Exceed attributable deaths to such MVA, breast cancer, and AIDS.
– Apple, Motorola, Toyota, commercial aviation – 6 sigma 1: 3.4 million, 10-6
– Inpatient admission death 1: 336, 10-4
ICU, OR, and ED.
that lead people to make mistakes or fail to prevent them.
actions of a particular group
– Schematic behavior are automatic, practiced, repetitive actions.
simplifying processes and developing reminder systems and forcing functions (i.e., checklists).
– Attentional behavior requires conscious thought and analysis.
disciplinary action.
– Favor schematic over attentional behavior (i.e., checklists)
Classes of latent errors Specific examples Patient factors Complexity of illness Health literacy Personality and cultural factors Socioeconomic status Task factors Task design and clarity of structure Availability and use of protocols/checklists Decision-making aids T echnology factors Integration of technology into workflow Potential for technology to create new errors Interoperability Overreliance on technology Individual staff factors Competence Knowledge and skills Physical and mental well-being Asking for help when needed T eam factors T eam structure (congruence, consistency, leadership) Verbal communication Written communication Supervision Work environmental factors Staffing level and skill mix Workload and shift patterns Design, availability, and maintenance of equipment Administrative and managerial support Physical environment Organizational and Management Factors Safety culture and priorities Financial resources and constraints Organizational structure Policies, standards, and goals Institutional context factors Economic and regulatory context Links with external organizations
benefit.
values guide all clinical decisions.
geographic location, disability, socioeconomic status, etc.
– Inappropriate formula mixing / dilution with water – Inappropriate formula / breastmilk alternatives
– Inability to purchase sufficient formula – Delay in seeking care
discharge
– No PCP identified at 1st hospital discharge – Infant lost to follow-up
– What type?
evidence of system flaws, not character flaws.
to the punishment of those who err.
patients.
– Focus on a much broader set of errors, mainly those that do no
be fixed before the occurrence of serious harm.
Physiologic Factors Pharmocologic Factors Drug Administration Errors Ordering Errors
Transcribing Spelling Pharmacokinetics Renal Dilution Time Nurse Route Rate
ADE
Nurse Physician Pharmacist Physician Pharmacy Nurse/Clerk Pharmacist Patient Physician Dietician Patient
Wrong Drug Dose Scheduling Dosage Route Past Allergic Reaction Absorption Weight Age Gender Electrolyte Hepatic Race Pharmacodyamics Expected Drug/Drug Unforeseen Drug/Food Drug/Lab Cognitive Psychiatric Compliance
Patient Errors
Order Missed
Place outcome here
Example: Adverse Drug Events (ADE)
Communication Context Knowledge System Practice Adverse Event Other
Communication Context Knowledge System Practice Adverse Event Other
– Trying to figure out the right thing to do.
– Healthcare delivery science. – How to make sure that the right thing happens every single time. – Elimination of unintended variation in process/product.
Implementation Gap
Scientific understanding Patient care
Time
people involved.
solutions.
system failures, process errors, and performance gaps.
hard work will not cut it in complex medical environment.
knowledge of human factors.
Aims are broad, intangible, and abstract. Objectives should follow a SMART framework:
if the change resulted in improvement?
admitted patients
PCP’s from 54% of discharges to 80% of discharges each month.
What are we trying to accomplish? How we will know that a change is an improvement? What change can we make that will result in an improvement?
Langley, Nolan, Nolan, Norman & Provost 1999
ACT PLAN DO STUDY
– plan a change – do it in a small test – study its effects – act on what learned
ACT
What changes can be made for t he next cycle (adapt change, anot her t est , implement at ion cycle? )
what , when, where)
(who, what , when, where)
DO
Complet e analysis
Compare result s t o predict ions S ummarize knowledge gained
TUDY
– How are we doing?
to sustaining processes over time. Primarily for licensing/accreditation. – Example: intensivists in the ICU to decrease mortality.
whether medicine is practiced according to protocol/guidelines. – Example: compliance with extubation protocol.
– Example: re-intubations.
genetic, environmental, and behavioral factors. Based on group results. – Example: number of days on ventilator or BPD rate.
20% 93% 85% 77% 79% 95% 87%
estimate 1161 881 259 273 280 91
2000 4000 6000 8000 10000 12000 14000 16000 18000 200000% 10% 20% 30% 40% 50% 60% 70% 80% 90% 100%
FY'11 FY'12 (pre APeX) Oct'12- June'13 Q1'14 Q2'14 Q3'14 Apr'14
% Documented D/C Communication to PCPs
%Documented Discharge Communication to PCPs N Practice Change
4.9% 4.6% 3.0% 3.6% 4.1% 4.1% 3.8% 4.1% 68 60 38 9 2000 4000 6000 8000 10000 12000 14000 16000 18000 20000 0.0% 2.5% 5.0% 7.5% 10.0% FY11 FY12 FY13 Q1'14 UCSF Comparable UHCs UCSF Readmits
Related and Unplanned Pediatric Hospitalist 30-Day Readmission Rate - UHC
FCR, M&Ms Transitions Taskforce
associated infection tracking system
6. Virtual PICU Systems
PHM BOOTCAMP: QUALITY IMPROVEMENT WORKSHEET
Choose one change to test in the first cycle:_________________________________
depending on what systems will be affected by your proposed changes and improvements.
QUALITY IMPROVEMENT REFERENCE SHEET
want your outcome to improve and by when?
improvement?
you had intended?
at the expense of the improvements you are making in one area?
Think about the obstacles to achieving your aim and how to change the system to
Once you have set an aim, established measures and selected changes to make, you are ready to begin your first PDSA cycle.
PLAN: Briefly describe the test: What Change(s) will be implemented and by whom? How will data be collected on outcome, process, and balancing measures? What do you predict will happen? Plan for change/ test: who, what, when, where Test start date: Target test completion date: List the tasks necessary to complete this test (what) Person responsible (who) When Where 1. 2. 3. 4. 5. 6. Plan for collection of data: What Data will be collected? How to collect it? How will you record it? Who is responsible for each step?
Do Study Act Plan
DO: 1) Educate staff; 2) Implement the changes; 3) Record data, problems and observations. Was the cycle carried out as planned? What did you observe that was not part of our plan? STUDY: Compare the result of your test to your previous performance: Did the results match your predictions? If not why not? What did you learn? What further changes need to be made/what actions need to be taken? ACT: Decide to Adopt, Adapt, or Abandon. Adapt: Improve the change and continue testing plan. Plans/changes for next test: Adopt: Select changes to implement on a larger scale and develop an implementation plan and plan for sustainability Abandon: Discard this change idea and try a different one