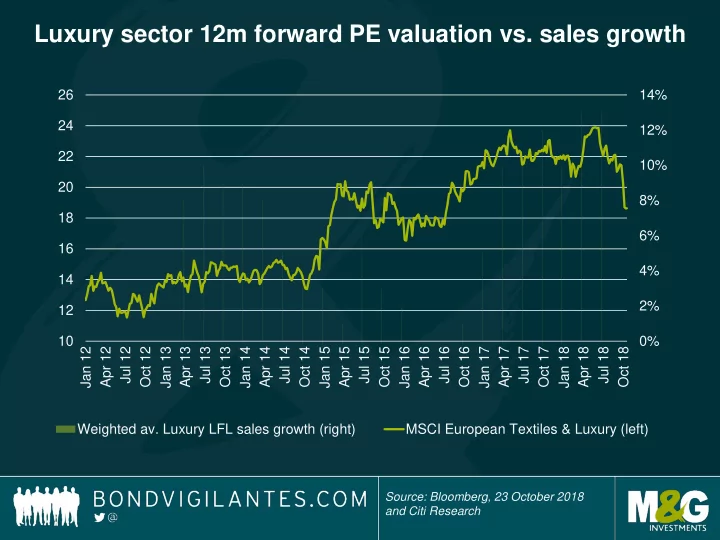
Luxury sector 12m forward PE valuation vs. sales growth 26 14% 24 12% 22 10% 20 8% 18 6% 16 4% 14 2% 12 10 0% Jan 12 Apr 12 Jul 12 Oct 12 Jan 13 Apr 13 Jul 13 Oct 13 Jan 14 Apr 14 Jul 14 Oct 14 Jan 15 Apr 15 Jul 15 Oct 15 Jan 16 Apr 16 Jul 16 Oct 16 Jan 17 Apr 17 Jul 17 Oct 17 Jan 18 Apr 18 Jul 18 Oct 18 Weighted av. Luxury LFL sales growth (right) MSCI European Textiles & Luxury (left) Source: Bloomberg, 23 October 2018 and Citi Research
Consumption of luxury goods by nationality (€ bn) 350 300 250 200 150 100 50 0 2003 2004 2005 2006 2007 2008 2009 2010 2011 2012 2013 2014 2015 2016 2017 Sales of global luxury goods to Chinese consumers Sales of global luxury goods to non-Chinese consumers Source: Morgan Stanley Research, Bain, Altagamma B O N D V I G I L A N T E S
Online sales of luxury continue to outpace the market 12% 40% 35% 10% 30% 8% 25% 6% 20% 15% 4% 10% 2% 5% 0% 0% 2008 2009 2010 2011 2012 2013 2014 2015 2016 2017 2018E Penetration of online sales Growth in online luxury Source: Deutsche Bank, Bain
The week ahead Monday 29: UK mortgage approvals, US PCE inflation Tuesday 30: Eurozone GDP, US Conference Board Consumer Confidence, Japan Industrial Production Wednesday 31: Eurozone CPI, Canada GDP Thursday 1 : UK Bank of England rate decision, inflation report; US PMI Friday 2 : Eurozone Manufacturing PMI, US jobs report Source: Bloomberg as of 26 Oct. 2018. B O N D V I G I L A N T E S
Recommend
More recommend