introduction
play

Introduction First we will look at the current U.S. situation in - PDF document

Introduction First we will look at the current U.S. situation in household income, expenditure, saving, and borrowing. Here when we talk about savings we are using this term as the opposite of consumption. Whatever you dont consume is


  1. Introduction  First we will look at the current U.S. situation in household income, expenditure, saving, and borrowing.  Here when we talk about savings we are using this term as the opposite of consumption. Whatever you don’t consume is considered saved. So this is different from the usage of the term in the unit on financial investment. 1 2 Household income over Time Median Household Income by State (Census)  For income, we often use the median household income as a  Most recent data (2014) measure. Because there is a large income disparity in the U.S,  U.S. : $53,657 mean income is very skewed.  Utah: $ 60,922 (ranked 14 th in the nation)  Patterns over time for real median household income in the U.S.:  Highest and lowest  Maryland: $ 73,971 – highest  Mississippi: $ 39,680 – lowest  Neighboring states  Idaho: $ 47,861 (38 th )  Colorado: $61,303(13 th )  Nevada: $51,450 (28 th )  http://factfinder.census.gov/faces/tableservices/jsf/pages/pro ductview.xhtml?pid=ACS_14_1YR_R1901.US01PRF&prodType=ta ble 3 4 Income by Age: Median household Map of States by Median Household Income in 2014 income in 2014 (Census data)  Note the pattern of income over life-span. Income is low at young age, increases and reaches peak in middle age, and decreases after retirement . Author: Ali Zifan using Census data. Graph at https://upload.wikimedia.org/wikipedia/commons/7/74/Map_of_states_by_median_household_income_in_2014.svg
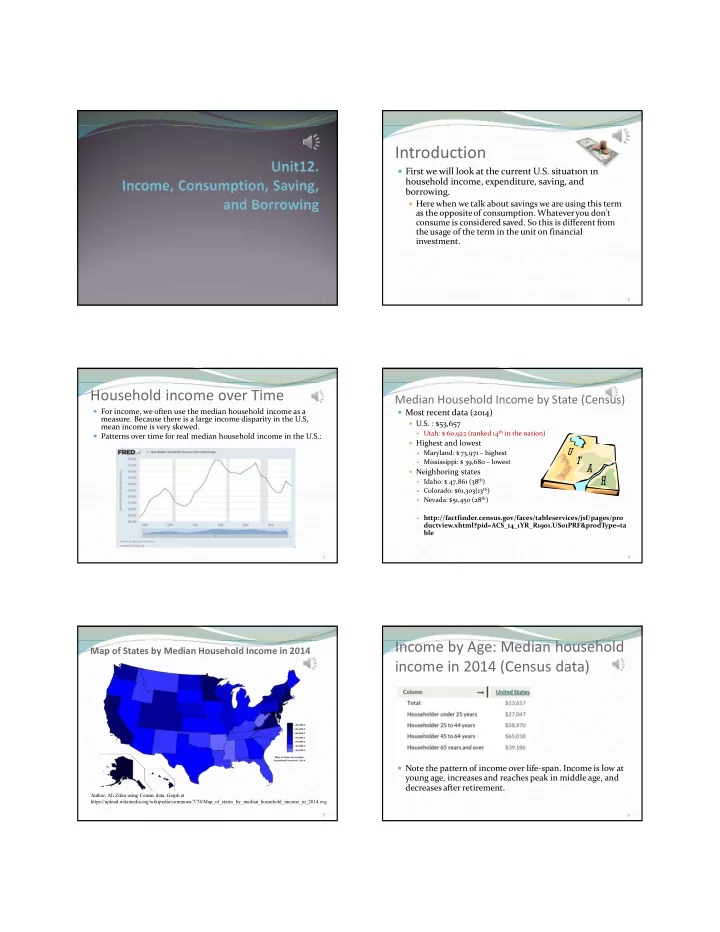
 5 6

  2. Expenditure Data (2013) from Savings Data Consumer Expenditure Survey (BLS)  Personal saving as a percentage of personal disposable income by year  1990: 6.5%, 2000: 2.9%, 2005: 1.4% Item Expenditure ($) Budget share  2010: 5.8%, 2015: 5.1% Average annual $51,100 expenditures Food $6,602 12.9% Housing $17,148 33.6% 3.1% Apparel and services $1,604 Transportation $9,004 17.6% 7.1% Health care $3,631 Entertainment $2,481 4.9% Education $1,138 2.2% 10.8% Insurance and pension $5,528 All others $3,964 7.8% 7 8 Borrowing Data Explaining the Relationship between  Household debt service ratio is an estimate of the ratio of debt payments to Consumption and Saving disposable personal income. Debt payments consist of the estimated required payments on outstanding mortgage and consumer debt.  Over time economists have developed several theories  Selected years: 1990: 12.03%, 2000: 12.59%, 2005: 13.77%, 2010: 11.75%, 2015: 10.07%  The financial obligations ratio adds automobile lease payments, rental payments on trying to explain how people make decisions about tenant-occupied property, homeowners’ insurance, and property tax payments to the debt service ratio. consumption vs. saving.  Selected years: 1990: 17.46%, 2000: 17.66%, 2005: 18.46%, 2010: 18.64%, 2015: 15.38%  Among them, the life-cycle saving’s hypothesis and its improved forms such as the behavioral life-cycle saving’s hypothesis are most popular. 9 10 Life-Cycle Saving’s Hypothesis Life-Cycle Saving’s Hypothesis  A typical income path over life time  In the 1950s, Franco Modigliani and Milton Friedman  low income at young age --> increasing --> decrease after independently developed what became known as the retirement life-cycle saving’s hypothesis.  A desirable consumption path  The idea is that people borrow and save in order to  To maximize life time satisfaction, a consumer would want to have a smooth path of consumption over their life cycle. smooth out their consumption over lifespan.  To achieve a smooth path of consumption, consumers may rationally use the tool of credit and saving  Young age: low income, expect higher future income -> Borrow  Middle age: high income, expect lower income after retirement -> Pay debt, save for retirement  Old age: low income -> Use retirement savings 11 12

  3. Behavioral Life-Cycle Saving’s Life-Cycle Saving’s Hypothesis Hypothesis Income/Consumption  Over the years scholars have added to that idea, mostly Saving/Paying Debt noticeably behavioral life-cycle models, which states that people mentally separate income from different sources and spend them at different rates. Borrowing Income Path  As such the saving and consumption patterns are not as simple as the original life-cycle saving’s hypothesis would predict. Consump. Path Age 18 65 13 14 Additional Issues of Income Additional Issues of Consumption  What are necessity goods?  Is income given or can you do something about it?  When income increases, people spend less of a budget share on  Yes you can. these goods  Education, choice of work hours, balance between  Example: Food at home is a necessity. family and work. These all affect your income.  What are luxury goods?  What are the most important determinants of  When income increases, people spend more of a budget share on these goods income?  Example: heated towels, luxury cars  As we covered in Unit09: human capital and number of  What are status goods? hours one works are the main factors.  Goods that convey status – visible to others or easily talked about in social conversations (they also have utilitarian functions)  Example: Sunroof, designer clothing, vacations. 15 16 Additional Issues of Saving How to Do Retirement Planning?  Step 1. Determine the annual consumption level you  There are many reasons for saving, but the main want when you retire – be sure to adjust for inflation ones are:  Step 2. Determine how much annual income you will  Retirement have in retirement from Social Security and/or pension  Purchase of big-ticket items  Step 3. Determine the gap between what you need and  Special expenses (vacation, wedding, education, etc.) what SS provides – this is the amount you will need to  Prepare for unforeseen emergencies like illness and job get from your own retirement saving loss  Step 4. Determine the retirement saving amount (nest egg) you need in order to generate that annual income.  In the next several slides we will focus on the  Step 5. Determine how much to save each year in order decision of saving for retirement. to have that nest egg 17 18

  4. An Example of Retirement Planning An Example of Retirement Planning  Step 1. You need to know how much annual consumption you  You are currently 22, and you plan to retire at 67 want to have after retirement. Often you can use your current (eligible for full Social Security benefits) consumption level as a reference point and adjust it as needed.  You start working at 22 after college. Your income will Typically housing expenditure probably will go down, but medical expenditure will go up. be $30,000 when you first start working. Income will  In this example suppose you want a consumption level in increase at the average rate of wage increase. retirement that is similar to $30,000 can provide today.  Assume Annual inflation rate = 4%  Then you need to adjust for inflation. Assume 4% inflation rate per year, then Retirement need per year =30,000*(1+4%)^ 45 =175,235  It may look shocking but at 4% inflation rate, you will need $175,235 after 45 years (45=67-22) to get the same standard of living you have today for $30,000. 19 20  Step 2. Go to Social Security Website at  Step 3. You need to have $ 175,235 per year for http://www.ssa.gov/planners/calculators.htm to retirement. But Social Security + Pension will only give estimate your social security benefits when you retire you $72,000 per year. You have a gap to fill:  Suppose you find out that you will have about $72,000  Gap = 175,235 – 72,000 = 103,235 (6,000 per month) in inflated value, or $12,000 (1,000 per month) in current value.  If you have pension, add it to Social Security as well. Suppose in this case you do not have pension 21 22  Step 4. Suppose your life expectancy is 82. You can purchase annuity that will pay you $103,235 per year to fill the gap.  Most annuities act like insurance: Even if you  I know this looks quite scary – you need about a outlive the average life expectancy you still get million dollars by the time you retire in order to keep a paid. $30,000 / year current standard of living.  How much of a nest egg do you need in order to  Don’t worry. If you start saving early, it is not too bad generate an income of $103,235 per year with a 6% …. annuity interest rate? Remember annuity computation we did in Unit04 (Use EOM formula).  Nest egg = 103,235*PVFS(n=15, r=6%) = 103,235*9.712249=1,002,644  Note n=82-67=15, r=6% is the annuity interest rate 23 24

Download Presentation
Download Policy: The content available on the website is offered to you 'AS IS' for your personal information and use only. It cannot be commercialized, licensed, or distributed on other websites without prior consent from the author. To download a presentation, simply click this link. If you encounter any difficulties during the download process, it's possible that the publisher has removed the file from their server.

Recommend


More recommend