
SLIDE 1
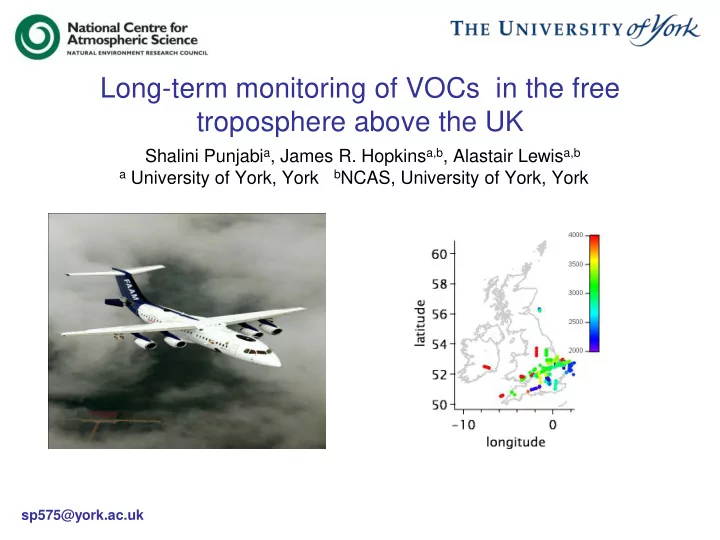
Long-term monitoring of VOCs in the free troposphere above the UK
Shalini Punjabia, James R. Hopkinsa,b, Alastair Lewisa,b
a University of York, York bNCAS, University of York, York
Long-term monitoring of VOCs in the free troposphere above the UK - - PowerPoint PPT Presentation
Long-term monitoring of VOCs in the free troposphere above the UK Shalini Punjabi a , James R. Hopkins a,b , Alastair Lewis a,b a University of York, York b NCAS, University of York, York sp575@york.ac.uk VOC monitoring : Aims To
a University of York, York bNCAS, University of York, York
1000 2000 3000 4000 5000 6000 7000 8000 9000 500 1000 1500 2000 2500 3000 3500 Ethane pptv altitude m 2009-11 data
Hopkins, J.R., Lewis, A.C. & Read, K.A. (2003) , J. Environ. Monit., 5 (1), pp. 8-13.
0.05 0.1 0.15 0.2 0.25 0.3 Ethane Ethene Propane Propene Iso-butane n-butane Acetylene trans-2-butene 1-butene cis-2-butene Iso-pentane n-pentane 1,3-butadiene trans-2-pentene 1-pentene 2+3-methylpentane n-hexane Isoprene n-heptane Benzene
toluene ethylbenzene m+p-xylene
PCRF (pptv) NPL-30comp mix 2009 NPL GAW 28 comp mix NPL-30 comp mix 2008 CVO
Jan 2011 Oct 2009
500 1000 1500 2000 2500 3000 3500 Jan Feb Apr Jun Aug Oct Dec Feb Apr Jun Aug Oct Dec Feb Apr Jun 2009-2011 month Ethane pptv 2009-11 all datapoints Ethane mean U.K free troposphere study North Atlantic study Pallas study
Laurila, T. and Hakola, H., 1996 ,Atmospheric Environment 30, pp. 1597–1607 S.A. Penkett, N.J. Blake, P. Lightman, A.R.W. Marsh and P. Anwyl, Journal of Geophysical Research 98 (1993), pp. 2865–2885
100 200 300 400 500 600 700 800 Jan Feb Apr Jun Aug Oct Dec Feb Apr Jun Aug Oct Dec Feb Apr Jun 2009-11 month acetylene pptv 2009-11 all data ace avg U.K free troposphere study North Atlantic study Pallas study
Laurila, T. and Hakola, H., 1996 ,Atmospheric Environment 30, pp. 1597–1607 S.A. Penkett, N.J. Blake, P. Lightman, A.R.W. Marsh and P. Anwyl, Journal of Geophysical Research 98 (1993), pp. 2865–2885
y = 2.334x - 52.151 R2 = 0.8231 200 400 600 800 1000 1200 1400 100 200 300 400 500 600 acetylene pptv propane pptv 2009-11 data y = 0.3811x + 1.0777 R2 = 0.6566 y = 0.3925x + 0.3421 R2 = 0.3179
0.00 1.00 2.00 3.00 4.00 5.00
0.00 1.00 ln[propane] ln [propane/acetylene] 2009-11 data North Atlantic data
Goldan, P. D., D. D. Parrish, W. C. Kuster, M. Trainer, S. A. McKeen, J. Holloway, B. T. Jobson, D. T. Sueper, and F. C. Fehsenfeld (2000), J. Geophys. Res., 105(D7), 9091–9105, doi:10.1029/1999JD900429. Gong, Q., and K. Demerjian (1997), J. Geophys. Res., 102(D23), 28059-28069.
y = 1.5475x + 7.8624 R2 = 0.9247 y = 1.2993x + 8.3649 R2 = 0.9958 0.0 1.0 2.0 3.0 4.0 5.0 6.0 7.0 8.0
0.00 ln[propane/ethane] ln[propane] 2009-11 data B458-60 June samples B457 June samples y = 1.4615x - 0.6902 R2 = 0.8232
0.00
0.00 ln[propane/ethane] ln[butane/ethane] 2009-11 data B458-60 June samples B457 June samples
Parrish, D. D., et al. (2004), J. Geophys. Res., 109, D23S18, doi:10.1029/2004JD004978
y = 0.297x + 0.8372 R2 = 0.9066 y = 0.3342x + 8.2283 R2 = 0.5623 50 100 150 200 250 100 200 300 400 500 600
Acetylene pptv Benzene pptv
2009 data 2010-11 data
y = 6.9413x - 22.134 R2 = 0.8722
y = 6.7636x - 30.742 R2 = 0.6991 200 400 600 800 1000 1200 1400 1600 50 100 150 200 250
Benzene pptv Propane pptv
2010-11 data 2009
Russo, R. S.; Zhou, Y.; White, M. L.; Mao, H.; Talbot, R.; Sive, B. C. Volume 10, Issue 1, 2010, pp.1083-1134
y = 28.463x + 114.34 R2 = 0.8956 10 20 30 40 50 60 70 80 90 100
0.00 ln propane/ethane
LT data from other seasons July data y = 0.8381x - 32.191 R2 = 0.9304 10 20 30 40 50 60 70 80 90 100 40 60 80 100 120 140 160 CO ppbv
July 2010 data
Helmig, D., D. M. Tanner, R. E. Honrath, R. C. Owen, and D. D. Parrish (2008), J. Geophys. Res. , 113 , D20S91, doi:10.1029/2007JD008930.