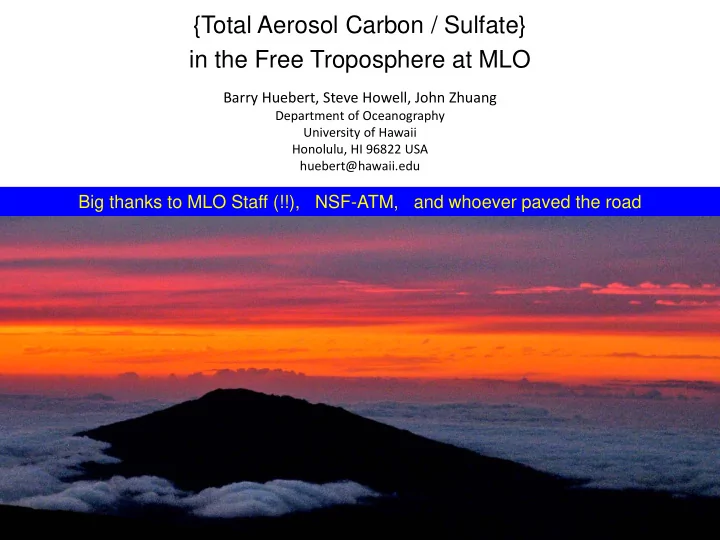

{Total Aerosol Carbon / Sulfate} in the Free Troposphere at MLO Barry Huebert, Steve Howell, John Zhuang Department of Oceanography University of Hawaii Honolulu, HI 96822 USA huebert@hawaii.edu Big thanks to MLO Staff (!!), NSF-ATM, and whoever paved the road
Two Decades of Nightly Anions and Cations at MLO Sulfate – All and Non ‐ local I ran out of time – still going in 2009 Calcium
Models have had difficulty with BL-to-FT transport upstream of MLO, But they do very well with aerosol scavenging enroute ECHAM4 Model ? MLO SO4 Obs Huebert, Phillips, Zhuang, Kjellstrom, Rodhe, Feichter, and Land (2001), Long ‐ term measurements of free ‐ tropospheric sulfate at Mauna Loa: comparison with model simulations, J. Geophys. Res., 106, 5479 ‐ 5492.
Daily and Monthly variability of Total Carbon Aerosol Asia N Amer Recent Good News: Newer Sunset NDIR detector has much lower noise! Resolved Sunset/PC problem
Spring 2009 UH Carbonaceous Aerosol Intensive at MLO Does the OC/SO 4 ratio increase in Asian Dust? How much OC and BC in the FT comes from Asia? Sulfate Filter collections and IC analysis – one nightly sample Aerodyne AMS Cabonaceous Aerosols Dual Sunset Labs Thermal/Optical analyzers – Doing Total Carbon, TC (no OC nor EC) Aerodyne AMS Aethalometer (absorbing aerosols, BC) SP3 soot probe Full Annual Cycle Ogren Data (Thanks!) PSAP, Nephelometer, Meteo Calcium: Dust Proxy Duration : March and April, 2009 All Sulfate All the 2009 Intensive Data is Preliminary
Two months UH Intensive Aerosol Chemistry Observations at MLO The following data are Hot off the mountain and not yet fully QC’d. Dust Episodes Scattering data courtesy John Ogren
Spring 2009 Time-Series for Sulfate and for OC & TC Aerodyne AMS and Filter data in each plot AMS ‐ OC vs Sunset ‐ TC plot slope = 1.8, R2 = 0.72 Thanks to Tony Clarke for AMS data
TC/SO 4 (Filters) and OC/SO 4 (AMS) ratios : Is there more Aerosol Carbon than Sulfate in the FT? Heald et al., “A large organic aerosol source in the free troposphere missing from current models,” GRL , doi:10.1029/2005GL023831: Their modeled (red) OC/SO4 ratio in the FT was 0.2 – 0.3, while the ACE ‐ Asia measured (black) value was 3 – 4. Our MLO data agree a bit better with the model, although a few samples have ratios close to those off the Asian coast. Is “a large OC source missing?”
Do dust events (Asian outflow) change TC/SO4? TC / SO 4 More Asian >> Apparently Not TC More Asian >>
Black Carbon (bap, really) does show the springtime Asia peak Black Carbon was 10 ‐ 50% of Total Carbon during the 2009 Intensive
How scavenged is the BC at MLO? • CO is a non ‐ scavenged tracer of industrial and Biomass Industrial biomass ‐ burning plumes • CO/BC ratio changes with different Scavenged sources Background Clarke & Howell: Airborne data over Alaska, Northern Canada, and the Arctic Ocean in April 2008 We can’t do this analysis for MLO: we can’t get CO data yet
Recommend
More recommend