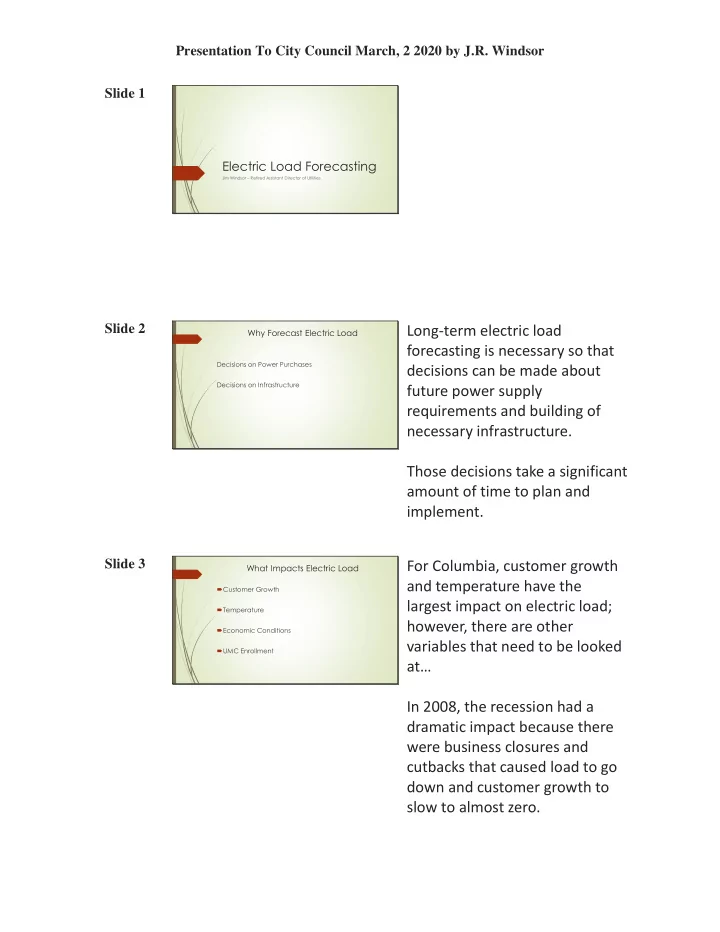

Presentation To City Council March, 2 2020 by J.R. Windsor Slide 1 Electric Load Forecasting Jim Windsor – Retired Assistant Director of Utilities Slide 2 Long-term electric load Why Forecast Electric Load forecasting is necessary so that Decisions on Power Purchases decisions can be made about Decisions on Infrastructure future power supply requirements and building of necessary infrastructure. Those decisions take a significant amount of time to plan and implement. Slide 3 For Columbia, customer growth What Impacts Electric Load and temperature have the Customer Growth largest impact on electric load; Temperature however, there are other Economic Conditions variables that need to be looked UMC Enrollment at… In 2008, the recession had a dramatic impact because there were business closures and cutbacks that caused load to go down and customer growth to slow to almost zero.
Presentation To City Council March, 2 2020 by J.R. Windsor Just a few years ago, there was a downturn in enrollment at the University. The result was fewer students to rent off-campus housing. Slide 4 Efficiency will impact the long- What About Efficiency and Solar? term requirements but not the Efficiency Solar near-term. All prior efficiency is 100.0% 90.0% Does Impact Long-Term (10 Years+) 80.0% 70.0% part of existing conditions. In 60.0% All Prior Efficiency Already Counted 50.0% 40.0% 30.0% addition, air conditioning Efficiency Declines 20.0% 10.0% 0.0% 1 3 5 7 9 11 13 15 17 19 21 23 efficiency is impacted by annual System Peak Solar maintenance which often does not occur. The Columbia electric system typically peaks in the late afternoon when the sun is going down. Utilities with high amounts of solar installations (Az for example) have found that peaks continue to increase.
Presentation To City Council March, 2 2020 by J.R. Windsor Slide 5 Some people may believe that 102.0% Columbia’s electric load is going 100.0% 98.0% down or at least not growing; 96.0% 94.0% however, if you understand what 92.0% 90.0% impacts electric load, you know 88.0% 86.0% that there is “latent” load in the 84.0% 2011 2012 2013 2014 2015 2016 2017 2018 2019 system that will become apparent. JW1 Slide 6 Temperature is the biggest driver 102.0% of electric load. The lowest 100.0% 98.0% monthly peak in a mild April can 96.0% 94.0% 92.0% be half the monthly peak of a 90.0% 88.0% hot July. 86.0% 84.0% 2011 2012 2013 2014 2015 2016 2017 2018 2019 Temperature Load This graph illustrates that recent summers have not been particularly hot and correspondingly, loads have not increased. In 2011, the high average hourly temperature during peak was 105. In 2012, the temperature was 102 and that was the last time a substation transformer failed In subsequent years, the temperature during peak has stayed around 97 degrees.
Presentation To City Council March, 2 2020 by J.R. Windsor Slide 7 Here is some weather Weather Facts Recent Missouri summers have not been exceptionally hot compared to information that shows what hot others in the past, ie. 1901, 1934, 1936, 1954 and 1980. The biggest degree of summer warming has been with minimum temperatures. Columbia 1980 – weather really looks like During 45-day period starting June 27, there were 27 Days at or above 100 degrees 11 days above 105 Highest temperature 111 If you were here in 1980, you 14 consecutive days from 102 to 109 Columbia 1954 – two separate days at the record high for Columbia of 113 degrees may remember how that Columbia 1936 – 44 days at or above 100 degrees summer was Slide 8 Electric load forecasting allows Electric System Vulnerability Conditions exist that endanger the electric system us to do “what-if” scenarios. All At 97 degrees, some existing circuits are overloaded At 97 degrees, both transformers at Perche Creek Substation of us take actions based on were loaded at 80% of capacity – before Westbury Village There are 5,160 more customers than in 2011 when the last system peak occurred, and the temperature got to 105 “what-if”. Just think about why degrees Columbia’s economy recovered from the recession and is growing you have various types of UMC enrollment is growing again after a downturn Rental properties that previously may have had electric service but no occupant, now have individuals using more electricity and increasing load insurance – what-if? Add one hot summer Based on my 30 years of experience in electric load forecasting, I am sure that the electric system is extremely vulnerable to a hot summer. Our electric system infrastructure shouldn’t be based on what-if it never gets above 97 degrees
Presentation To City Council March, 2 2020 by J.R. Windsor Slide 9 Another 1980! What What if we hit the temperatures Could Happen? we hit in 1980? Distribution Transformer or Substation Transformer Issues
Recommend
More recommend