
SLIDE 1
William Sandqvist william@kth.se
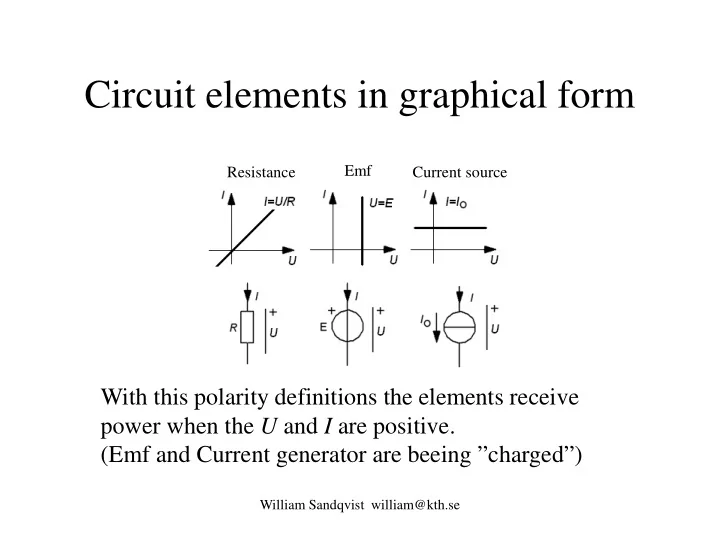
Circuit elements in graphical form
With this polarity definitions the elements receive power when the U and I are positive. (Emf and Current generator are beeing ”charged”)
Resistance Emf Current source