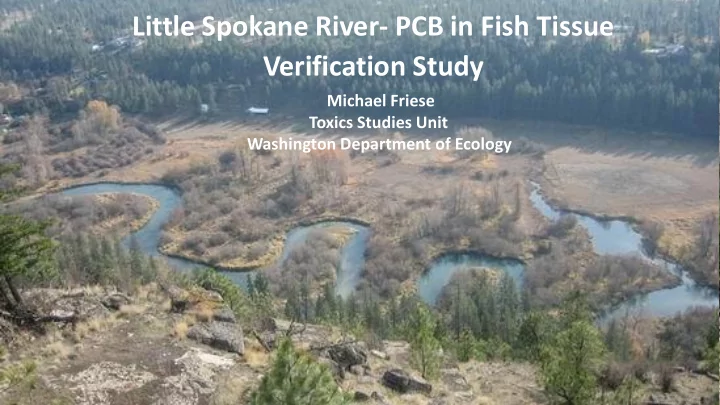

Little Spokane River- PCB in Fish Tissue Verification Study Michael Friese Toxics Studies Unit Washington Department of Ecology
Project Objectives Assess current levels of PCBs in the Little Spokane River. Last sampling conducted in 1997 produced category 5 303(d) listings. Sampling • Collected fish (as composites) upstream and downstream of the Spokane fish hatchery and analyze for PCB congeners. • Collected sediment samples from spatially representative locations and analyze for PCB congeners. • Collected water with Continuous Low-Level Aquatic Monitoring (CLAM) devices at two stream locations during high and low flow and analyze for PCB congeners.
7 Sediment Sites: 2 Water Sampling Sites: • • Eloika Deer/Milan- upstream • Deer/Milan “reference” site • • Colbert Painted Rocks- downstream • Little Deep of tributaries and major • Deadman groundwater influences • Hatchery 3 Fish Collection Sites: • Painted Rocks • Deer/Milan- upstream • Colbert- midstream • Hatchery- downstream
t-PCB in Little Spokane River Fish Species Concentration (ug/kg) Sample Type Year Collected Number in Composite Data Source Mountain whitefish 145 Fillet 1994 8 Ecology, 1995 Mountain whitefish 235 Fillet 1994 8 Ecology, 1995 Mountain whitefish 285 Fillet 1994 8 Ecology, 1995 Cutthroat trout 188 Fillet 1994 1 Ecology, 1995 Largescale Sucker 440 Whole Fish 1994 5 Ecology, 1995 Mountain whitefish 164 Fillet 1996 8 Johnson, 1997 Mountain whitefish 130 Fillet 1996 8 Johnson, 1997 Mountain whitefish 53 Fillet 1996 8 Johnson, 1997 Largescale Sucker 336 Whole Fish 1996 5 Johnson, 1997 Rainbow Trout 4 Fillet 2014 3 Present Study Rainbow Trout 11 Fillet 2014 3 Present Study Northern Pikeminnow 62 Fillet 2014 3 Present Study Mountain Whitefish Fillet 2014 1 Present Study 33 Rainbow Trout Fillet 1 Present Study 12 2014 FTEC 5.3 Fillet National Toxics Rule n/a ≥ 3
Total PCB in Little Spokane River Fish Fish Sampled from 3 Locations: 1) Deer/Milan- upstream site, 70 reference location 377 mm 2) Colbert- Mid-river 3) Hatchery- downstream site, 60 just below Spokane Fish Hatchery 50 40 ug/kg 300 mm 30 20 302 mm 319 mm 10 Fish Tissue Equivalent 247 mm Concentration (FTEC) 5.3 ug/kg 0 Downstream of Hatchery Downstream of Hatchery Downstream of Hatchery Deer/MilanRainbow Colbert Rainbow Trout Rainbow Trout Mountain Whitefish Northern Pikeminnow Trout
Distribution of Little Spokane River Fish t-PCB Results Within Statewide t-PCB Results 1,000.0 2001-2013 Statewide FFCMP 2014 Little Spokane River 100.0 t-PCB (ug/kg) 10.0 Washington FTEC (5.3 ug/kg) 1.0 0.1 0% 10% 20% 30% 40% 50% 60% 70% 80% 90% 100% Percentile
Water sam ampl ples colle ollected d wi with th CLAM CLAM samp ample lers National Toxics Rule Human Health Criteria (as FTEC) = 170 pg/L (sample volumes above histogram bars) CLAM Water Samples and Blanks (pg/L) 100 75 picograms/Liter 50 19.4 L 28.0 L 25 55.2 L 48.8 L 35.7 L 0 Painted Rocks Fall Blank Painted Rocks Fall Sample Deer Park/Milan Fall Blank Deer Park/Milan Fall Sample Painted Rocks Spring Blank Painted Rocks Spring Sample Painted Rocks Spring Rep Blank Painted Rocks Spring Rep Sample Deer Park/Milan Spring Blank Deer Park/Milan Spring Sample Take home message- PCB concentrations were not high enough to separate from the background noise. PCB levels in Little Spokane River water were too low to reliably quantify.
Total PCB in Little Spokane River Sediments (ug/Kg) Sediment Cleanup Eloika Objective = 110 ug/kg (WAC 173-204) Deek Pk/Milan Colbert Little Deep Crk Deadman Crk Hatchery Painted Rocks 0 1 2 3 4 Total PCB (ug/kg)
Conclusions: • 3 of 4 fish composite samples exceeded Human Health Criteria (as FTEC) from the National Toxics Rule. • Despite blank issues and system noise, CLAM collected water samples indicate low concentrations of PCB in water. • Sediment results show a pattern of PCB concentrations increasing downstream, concentrations range from 0.5 to 3.9 ug/kg. • PCB concentrations in most fish tissue are at or just above background levels, Northern Pikeminnow are elevated above Washington background levels which were established during an Ecology study that assessed PCB concentrations in waterbodies that exhibited relatively low direct impact from human activities.
Recommend
More recommend