
SLIDE 1
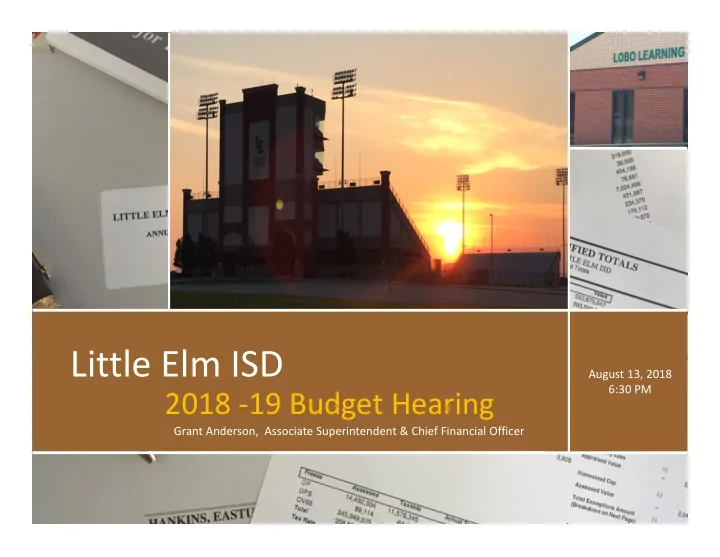
Little Elm ISD
2018 ‐19 Budget Hearing
August 13, 2018 6:30 PM Grant Anderson, Associate Superintendent & Chief Financial Officer
Little Elm ISD August 13, 2018 6:30 PM 2018 19 Budget Hearing Grant - - PowerPoint PPT Presentation
Little Elm ISD August 13, 2018 6:30 PM 2018 19 Budget Hearing Grant Anderson, Associate Superintendent & Chief Financial Officer Budget based on a $.10 Tax Rate Increase for Debt Service The 2018 19 proposed budget is based on
August 13, 2018 6:30 PM Grant Anderson, Associate Superintendent & Chief Financial Officer
Budget based on a $.10 Tax Rate Increase for Debt Service
Maintenance and Operations tax rate at $1.17 and increasing the Debt Service tax rate by $.10 from $.37 to $.47.
rate from $1.54 to $1.64. This is the first tax increase in 9 years (last increase was 2009‐10).
principal and interest for the sale of the bonds approved by the voters in the 2017 bond election.
reflects an 6.7% increase ($4.5 million) from 2017‐18’s initial board approved budget.
The state allocates funding based on a funding formula. This formula calculates how much state funding LEISD will receive. LEISD is a fast growth school district and is under heavy budgetary pressures due to adding 150‐300 new students each year. Over the past 5 years LEISD’s student enrollment has increased over 1,100 students. The proposed balanced budget is a product of ongoing instructional need assessment and prioritization.
and property tax collections. Two major Revenue drivers: Property Values 21% increase ($3.3 to $4.0 billion) Enrollment 3% increase (7,519 to estimated 7,748 students) major factor – tax rate & collections major factor – state funding formula
year’s comptroller values to determine current year local effort.
for the district’s net revenue to decrease from prior year. State funding formula uses prior year’s Comptroller Taxable Values for current year’s local assignment.
growth slowdown Current Year: 20% $1.6 million Next Year: 18% $1 million 16% $250 thousand 14% ($750 thousand) 12% ($1.7 million) 10% ($2.2 million) 8% ($3.4 million)
includes the one time 3% retention stipend.
level.
year and makes up 4% of propose budget.
schools, custodians, technology, and safety and security.
41 recapture to equalize wealth payments make up the other 4% of the M&O budget.
Appropriations increase $4.5 million from 2017‐18’s initial budget to the 2018‐19 proposed budget. $2.96 million is for Payroll and payroll related costs. This is mainly due to: 1) Additional $192 per year health insurance contribution. 2) Additional 13 positions for 2018‐19 school year. 1) 3% retention stipend for staff based on the criteria discussed at August 2018 Board Workshop. The administration will recommend the board approve the 3% retention stipend at the August 20, 2018 regular board meeting. Prior Board Approval: 2) Additional stipend and equity adjustments. 3) Stipend list for 2018‐19 school year.
due to increases for contracts including Chapter 41 recapture, student transportation, and utilities.
Other major changes in appropriations:
$1,100,000 in recapture to the state. An increase of $600,000 from prior year.
Major Increases in Payroll Budget Major Costs Revenue Balance 2018‐19 Additional Funding Recap from initial 2017‐18 Budget This chart does not detail all the changes in payroll. There are other additional costs which were offset by decreases in line item payroll expenditures. Additional Revenue $4,476,000 TRS on‐behalf of entry $295,000 3% employee retention stipend $1,415,000 Additional health insurance contribution $229,000 13 new Positions for 2018‐19 school year $372,000 Total Increase in Payroll Budget: $2,960,000 $1,516,000 Additional stipends & equity adjustments $649,000
Major Increases in Non‐Payroll Budget Major Costs Revenue Balance Other Net Difference
(171,000)
2018‐19 Additional Funding Recap from initial 2017‐18 Budget Revenue available for non‐payroll budget $1,516,000 Chapter 41 state recapture to equalize wealth $600,000 Student Transportation Costs $198,000 Property and Casualty Insurance $124,000 Total Increase in Non‐Payroll Budget: $1,700,000 ‐ 0 ‐ Maintenance (Preventive Maintenance) $184,000 Safety & Security (SRO’s and safety equipment) $367,000 Technology (identity software, firewall support ) $214,000
Major Key Indicator: Major revenue to Payroll ratio Major Revenue: Major Revenue is total tax collections (less delinquent taxes) and state revenue less chapter 41 recapture. Major Revenue makes up 90% of LEISD’s M&O revenue. Major Cost: 78.49% of LEISD’s major revenue appropriations are allocated for payroll costs.
2014‐15 Actual 2015‐16 Actual 2016‐17 Actual 2017‐18 Budget 2018‐19 Budget Payroll to Major Revenue 76.22% 76.02% 74.92% 76.94% 79.05% Budgetary Surplus/(Deficit) 1.6 million $3.8 million $743 thousand $1 million ‐$0‐ *2018‐19 Budget set at 98% of revenue. Includes one time 3% retention
Historical Key Indicator: LEISD’s Payroll to Major Revenue.
Board Approved Funds / Function General Operating Fund Debt Service Fund Child Nutrition Fund Comparison to Prior Year’s initial budget Budget Presentation: Estimated Revenue & Appropriations Percentage change from prior year Percentage of Total Budget $ Amount per student Presentation: Budget presented in millions and comparative data is to the initial 2017‐18 budget
The following funds are required to be approved by the Board of Trustees at the function level (Section 44.0041 Education Code & Texas Education
Agency Financial Accountability Resource Guide, Budgeting Legal Requirements 2.6):
Board Approved Funds / Function
proceeds and expenditures.
long‐term debt.
expenditures for LEISD’s federal child nutrition program.
expenditures directly related to the instruction of a student)
Total Revenue, Expenditures, & Change in Fund Bal (FB) 2017‐18 Initial Approved Budget 2018‐19 Proposed Budget Change from Prior Year’s Initial Budget Estimated Revenue
$66.55 $71.0 $4.5
Appropriations (Expenses)
$66.55 $71.0 $4.5
General Operating Fund Major reasons for changes from prior year: Revenue increased $4.5 million from 2017‐18 initial budget mainly due to the increase in property tax collections from growing property values. Appropriations increased mainly due to: Increase in personnel costs from 2017‐18 initial budget. Note: Change from Prior Year’s final amended budget is nearly flat. Prior Year’s final amended estimated revenue is $71 million. Amounts in millions
Total Revenue by Source 2017‐18 Initial Budget % *$ per Student 7,519 2018‐19 Proposed Budget % $ per Student 7,748 % Chg
budget due to a decrease in estimated revenue from state funding formula.
tax revenue.
Local $43.0 64.5% $5,713 $51.5 72.5% $6,642 19.8% State $22.4 33.6% $2,972 $18.3 25.8% $2,364 ‐18.1% Federal $1.3 1.9% $166 $1.2 1.8% $161 0% Total $66.55 100% $8,851 $71 100% $9,168 6.7% Budget in millions
Major Revenue 2017‐18 Initial Approved Budget 2018‐19 Proposed Budget Change Property Tax State Formula Other Approximately 91‐92% of LEISD’s general fund revenue is generated from Property Taxes and State funding formula. Property $42.0 $50.7 $8.7 Tax State $18.8 $14.5 ($4.3) Formula Other $5.7 $5.8 $.1 Total Revenue $66.5 $71.0 $4.5 Budget in millions
General Fund Expenditures by Function Category 2017‐18 Initial Budget % $ per Student 7,519 2018‐19 Proposed Budget % $ per Student 7,748 % Chg
1x Instructional $40 60% $5,263 $42 59% $5,370 5.1% 2x School Leadership $5 8% $701 $5.4 7.7% $704 3.4% 3x Student Services $6.6 10% $882 $7.3 10% $942 10.1%
4x Admin Services $3.2 4.8% $423 $3.1 4.4% $405 (1.4%) 5x Support Services $8.9 13% $1,197 $10.3 14% $1,337 15% 6x Community Services $.04 ‐ $5 $.05 ‐ $7 26.5% 7x Debt Services $1.4 2% $187 $1.4 2% $181 ‐ 8x Capital Outlay $.6 .9% $78 $.2 .3% $25 (67%) 9x Intergovernmental $.9 1.3% $115 $1.5 2.1% $197 76% Total Appropriations $61.7 100% $8,365 $71 100% $9,168 6.7%
Budget in millions
General Fund Expenditures by Object 2017‐18 Initial Budget % $ per Student 7,519 2018‐19 Proposed Budget % $ per Student 7,748 % Chg
61xx Payroll $51.4 77.2% $6,830 $54.3 76.5% $7,010 5.8% 62xx Contracted $8.7 13% $1,152 $10.4 14.7% $1,346 20% Services 63xx Supplies & $2.7 4% $359 $2.8 4% $366 4.9% Materials 64xx Other Operating $1.7 3% $232 $1.9 2.6% $240 6.3% 65xx Debt Payments $1.4 2% $187 $1.4 2% $181 0% 66xx Capital Outlay $.7 .5% $91 $.2 .3% $26 (70%) Total Appropriations $66.55 100% $8,851 $71 100% $9,168 6.7%
Budget in millions
Debt Service Fund Revenue & Expenditures 2017‐18 Initial Budget $ per Student 7,519 2018‐19 Proposed Budget $ per Student 7,748 % Chg 3%
Total Revenue $13.7 $1,827 $21.3 $2,740 55% 71 Debt Service Pmts $11.9 $1,594 $21.1 $2,723 76% Budgeted Surplus/(deficit) $1.8 ‐ $.1 ‐ ‐
Debt Service Fund
Budget in millions
Child Nutrition Fund Revenue & Expenditures 2017‐18 Initial Budget $ per Student 7,519 2018‐19 Proposed Budget $ per Student 7,748 % Chg
Local Revenue $1.5 $206 $1.6 $212 6.2% 35 CN Expenditures $3.7 $495 $3.9 $497 3.4% Budgeted Surplus/(deficit) $0 ‐ $0 ‐ ‐
Child Nutrition Fund
Federal Revenue $2.2 $287 $2.2 $282 1.3%
State Revenue $.02 $3 $.02 $3 ‐
Budget in millions