
SLIDE 1
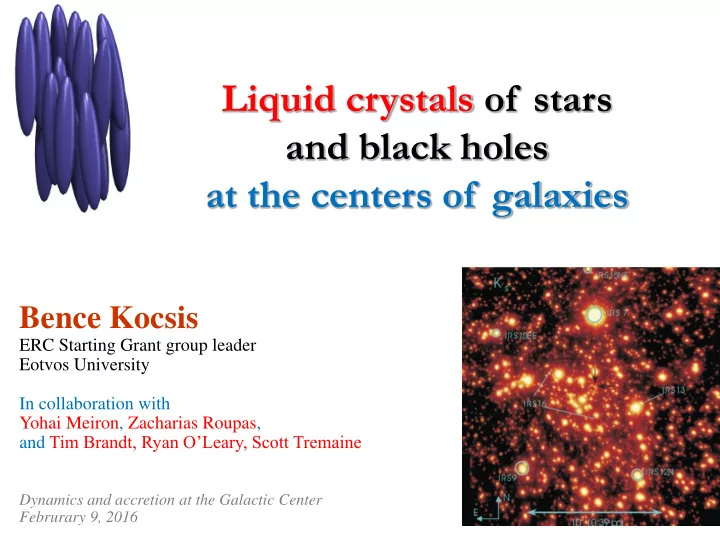
Bence Kocsis
ERC Starting Grant group leader Eotvos University In collaboration with Yohai Meiron, Zacharias Roupas, and Tim Brandt, Ryan O’Leary, Scott Tremaine
Dynamics and accretion at the Galactic Center Februrary 9, 2016
Liquid crystals of stars and black holes at the centers of - - PowerPoint PPT Presentation
Liquid crystals of stars and black holes at the centers of galaxies Bence Kocsis ERC Starting Grant group leader Eotvos University In collaboration with Yohai Meiron, Zacharias Roupas, and Tim Brandt, Ryan OLeary, Scott Tremaine
ERC Starting Grant group leader Eotvos University In collaboration with Yohai Meiron, Zacharias Roupas, and Tim Brandt, Ryan O’Leary, Scott Tremaine
Dynamics and accretion at the Galactic Center Februrary 9, 2016
O’Leary, Meiron, & Kocsis (2016 – arXiv tonight) Advanced LIGO will measure GWs soon!
Monte Carlo and Nbody simulations
Fermi measured excess gamma ray emission from the Galactic bulge
population (No need to invoke dark matter annihilation to explain the gamma ray excess, just ordinary MSPs) Brandt & Kocsis (2015)
Outside 0.27-0.47 pc Middle 0.13-0.27 pc Inside 0.03-0.13 pc
Yelda+ 2014
Outside 0.27-0.47 pc Middle 0.13-0.27 pc Inside 0.03-0.13 pc
Cos[ polar angle ] azimuthal angle azimuthal angle azimuthal angle Bartko+ 2009
Persistent (“resonant”) torques between smeared orbits cause rapid reorientation
(Rauch & Tremaine 1996, Hopman & Alexander 2006, Eilon, Kupi, Alexander 2009, ...)
Hamiltonian of resonant relaxation
Kocsis & Tremaine 2014
[1—104 yr ] [104—5 yr] [105–7 yr] [109 yr]
c.f: the observed distribution
Log[ distance from center ] Cos[ inclination ]
RMS inclination [deg] Cos[ inclination ] Log[ distance from center / 4 arcsec ] distance from center [arcsec]
Cos2[ inclination ] Cos[ inclination ]
0 C / 32 F
0 C / 32 F 5 C / 41 F
Distribtion of angular momentum directions:
– Liquid crystals have a similar Hamiltonian – First order phase transition mixed phase (disk + spherical) – Young stars in the Galactic center show a similar structure
– model the inclination distribution of different stellar types – predict the distribution of black holes
Kocsis & Tremaine (2011)
Keplerian orbit around SMBH Precession in plane Re-orientiation
Eccentricity change Semimajor axis change Disk age
Time scale
Log(semimajor axis) Cos[ inclination] Log(semimajor axis) T=0 T=500 T=1500 T=1000 T=500 T=0
Heavy objects in a disk Light objects spherical Heavy objects spherical Light objects in a disk Initially:
by stars on same radius
quadrupole moment
Find maximum entropy configuration under constraints
tot
tot
Phase transition in inclination
radius inner radius
Monte Carlo Markov Chain simulation
eccentricity
“microcanonical ensemble”
Phase transition in inclination
Multiple stellar populations
Walcher+ ‘06, Rossa+ ‘06, Seth+ 06, 08, 10
counterrotating with respect to galaxy