
SLIDE 1
Esben Budtz-Jørgensen April 22, 2008
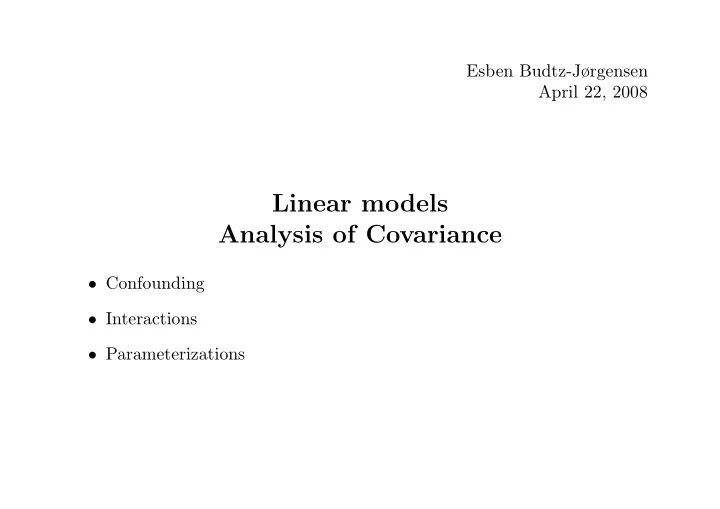
Linear models Analysis of Covariance
- Confounding
- Interactions
- Parameterizations
Linear models Analysis of Covariance Confounding Interactions - - PowerPoint PPT Presentation
Esben Budtz-Jrgensen April 22, 2008 Linear models Analysis of Covariance Confounding Interactions Parameterizations Analysis of Covariance group comparisons can become biased if an important predictor of the response is
1
2
female male 4 6 8
total lung capacity
female male 140 160 180
height
3
TTEST PROCEDURE Variable: TLC SEX N Mean Std Dev Std Error
16 5.19812500 1.30082138 0.32520534 M 16 6.97687500 1.43801585 0.35950396 Variances T DF Prob>|T| Unequal
29.7 0.0009 Equal
30.0 0.0009 For H0: Variances are equal, F’ = 1.22 DF = (15,15) Prob>F’ = 0.7028 Variable: HEIGHT SEX N Mean Std Dev Std Error
16 160.81250000 9.36816417 2.34204104 M 16 174.06250000 10.66126165 2.66531541 Variances T DF Prob>|T| Unequal
29.5 0.0008 Equal
30.0 0.0008 For H0: Variances are equal, F’ = 1.30 DF = (15,15) Prob>F’ = 0.6228
4
5
6
7
8
9
10
Dependent Variable: LTLC Sum of Mean Source DF Squares Square F Value Pr > F Model 3 0.27230446 0.09076815 13.05 0.0001 Error 28 0.19478293 0.00695653 Corrected Total 31 0.46708739 R-Square C.V. Root MSE LTLC Mean 0.582984 10.85524 0.08341 0.76835 Source DF Type I SS Mean Square F Value Pr > F SEX 1 0.13626303 0.13626303 19.59 0.0001 HEIGHT 1 0.13451291 0.13451291 19.34 0.0001 HEIGHT*SEX 1 0.00152852 0.00152852 0.22 0.6429 Source DF Type III SS Mean Square F Value Pr > F SEX 1 0.00210426 0.00210426 0.30 0.5867 HEIGHT 1 0.13597107 0.13597107 19.55 0.0001 HEIGHT*SEX 1 0.00152852 0.00152852 0.22 0.6429 T for H0: Pr > |T| Std Error of Parameter Estimate Parameter=0 Estimate INTERCEPT
0.5391 0.35221658 SEX F
0.5867 0.51102682 M 0.0000000000 B . . . HEIGHT 0.0060473650 B 2.99 0.0057 0.00201996 HEIGHT*SEX F 0.0014344422 B 0.47 0.6429 0.00306016 M 0.0000000000 B . . . 11
12
Dependent Variable: LTLC Sum of Mean Source DF Squares Square F Value Pr > F Model 2 0.27077594 0.13538797 20.00 0.0001 Error 29 0.19631145 0.00676936 Corrected Total 31 0.46708739 R-Square C.V. Root MSE LTLC Mean 0.579712 10.70821 0.08228 0.76835 Source DF Type I SS Mean Square F Value Pr > F SEX 1 0.13626303 0.13626303 20.13 0.0001 HEIGHT 1 0.13451291 0.13451291 19.87 0.0001 Source DF Type III SS Mean Square F Value Pr > F SEX 1 0.00968023 0.00968023 1.43 0.2415 HEIGHT 1 0.13451291 0.13451291 19.87 0.0001 T for H0: Pr > |T| Std Error of Parameter Estimate Parameter=0 Estimate INTERCEPT
0.2198 0.26135206 SEX F
0.2415 0.03520676 M 0.0000000000 B . . . HEIGHT 0.0066723630 4.46 0.0001 0.00149683
13
14
15
16
General Linear Models Procedure Dependent Variable: LBP Sum of Mean Source DF Squares Square F Value Pr > F Model 3 0.05583810 0.01861270 6.30 0.0006 Error 98 0.28952497 0.00295434 Corrected Total 101 0.34536306 Source DF Type I SS Mean Square F Value Pr > F LOBESE 1 0.03809379 0.03809379 12.89 0.0005 SEX 1 0.01597238 0.01597238 5.41 0.0221 LOBESE*SEX 1 0.00177193 0.00177193 0.60 0.4405 Source DF Type III SS Mean Square F Value Pr > F LOBESE 1 0.03920980 0.03920980 13.27 0.0004 SEX 1 0.01252714 0.01252714 4.24 0.0421 LOBESE*SEX 1 0.00177193 0.00177193 0.60 0.4405 T for H0: Pr > |T| Std Error of Parameter Estimate Parameter=0 Estimate INTERCEPT 2.087171366 B 165.93 0.0001 0.01257865 SEX female
0.0421 0.01908066 male 0.000000000 B . . . LOBESE 0.227981122 B 1.73 0.0863 0.13158758 LOBESE*SEX female 0.123097524 B 0.77 0.4405 0.15894836 male 0.000000000 B . . . 17
General Linear Models Procedure Dependent Variable: LBP Sum of Mean Source DF Squares Square F Value Pr > F Model 4 449.803216 112.450804 38062.97 0.0001 Error 98 0.289525 0.002954 Uncorrected Total 102 450.092741 ... Source DF Type III SS Mean Square F Value Pr > F SEX 2 141.530202 70.765101 23952.96 0.0001 LOBESE*SEX 2 0.054676 0.027338 9.25 0.0002 T for H0: Pr > |T| Std Error of Parameter Estimate Parameter=0 Estimate SEX female 2.047880703 142.73 0.0001 0.01434744 male 2.087171366 165.93 0.0001 0.01257865 LOBESE*SEX female 0.351078645 3.94 0.0002 0.08915879 male 0.227981122 1.73 0.0863 0.13158758 18
19
20
General Linear Models Procedure Dependent Variable: LBP Sum of Mean Source DF Squares Square F Value Pr > F Model 2 0.05406617 0.02703308 9.19 0.0002 Error 99 0.29129690 0.00294239 Corrected Total 101 0.34536306 ... Source DF Type I SS Mean Square F Value Pr > F SEX 1 0.00116215 0.00116215 0.39 0.5311 LOBESE 1 0.05290402 0.05290402 17.98 0.0001 Source DF Type III SS Mean Square F Value Pr > F SEX 1 0.01597238 0.01597238 5.43 0.0218 LOBESE 1 0.05290402 0.05290402 17.98 0.0001 T for H0: Pr > |T| Std Error of Parameter Estimate Parameter=0 Estimate INTERCEPT 2.081052655 B 213.05 0.0001 0.00976800 SEX female -0.027765105 B
0.0218 0.01191694 male 0.000000000 B . . . LOBESE 0.312347032 4.24 0.0001 0.07366198 NOTE: The X’X matrix has been found to be singular and a generalized inverse was used to solve the normal equations. Estimates followed by the letter ’B’ are biased, and are not unique estimators of the parameters. 21
22