Limulus The Neural Code Large eyes No color vision Responds to: - - PDF document

limulus
SMART_READER_LITE
LIVE PREVIEW

Limulus The Neural Code Large eyes No color vision Responds to: - - PDF document

9/21/2011 Crab cam (Barlow et al., 2001) self inhibition recurrent inhibition lateral inhibition - L16. Neural processing in Linear Systems: Temporal and Spatial Filtering C. D. Hopkins Sept. 21, 2011 Limulus The Neural Code Large eyes


slide-1
SLIDE 1

9/21/2011 1

  • L16. Neural processing in Linear Systems:

Temporal and Spatial Filtering

  • C. D. Hopkins
  • Sept. 21, 2011

Crab cam (Barlow et al., 2001)

  • self inhibition

recurrent inhibition lateral inhibition

3

The Neural Code

4

Limulus

  • Large eyes
  • No color vision
  • Responds to: brightness,

spatial pattern, temporal pattern

  • no eye movement

5

Limulus polyphemus Horseshoe crab 6

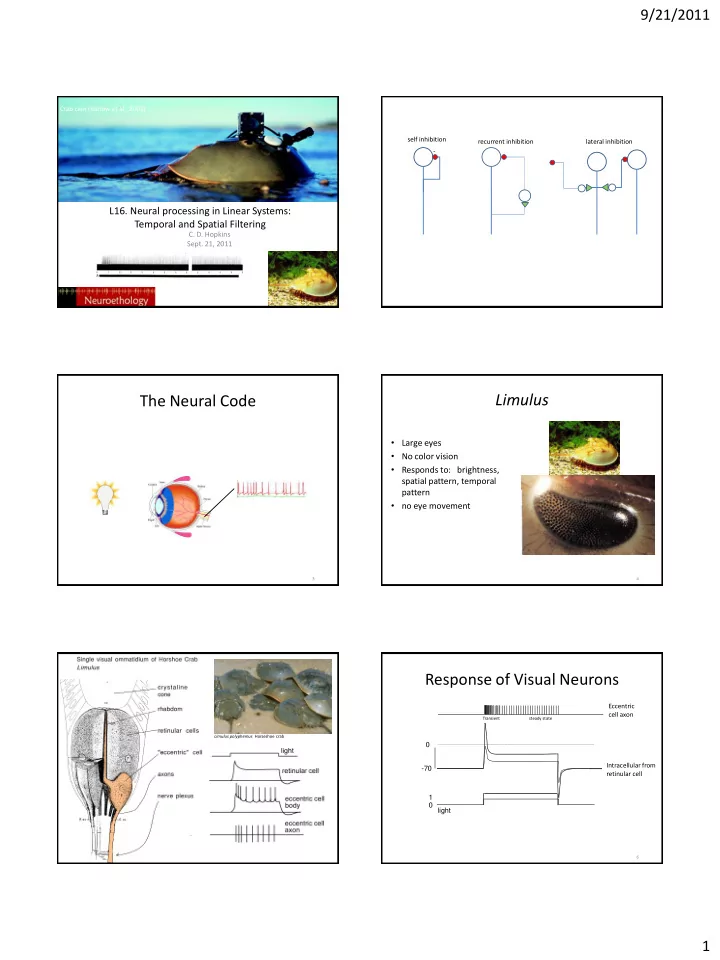
Response of Visual Neurons

light 1

  • 70

Intracellular from retinular cell Eccentric cell axon

Transient steady state

slide-2
SLIDE 2

9/21/2011 2

7

Limulus eye: a filter cascade.

light to voltage voltage to spike frequency cascade of filters

transduction encoding in

  • ut

and adaptation 8 light on

The Sensory Code for Stimulus Intensity is Spike Rate

1 10-2 10-4

  • ---1 second---------

9

transient steady state

10

Muscle stretch receptor

11

Vestibular hair cell plus neuron

12

Dynamic Range

Stimulus intensity (log scale)

threshold log linear range saturation damage

slide-3
SLIDE 3

9/21/2011 3

13 light on 1 10-2 10-4

  • ---1 second---------

transient adapted

14

Dynamic Response to Step Increase in Light Intensity

1) Light increment 2) Light decrement adaptation symmetrical (codes both)

15

How can we characterize a complex sensory process like adaptation?

Sensory receptors, nerve cells, synapses, and simple circuits, each act as stimulus filters. Can we think of each of these neural process as a well-behaved (predictable) filters?

input output FILTER

  • self inhibition

17

Transfer function?

Determine outputs for a known set of inputs. Generate model Predict output to arbitrary stimulus.

input output at each stage (neuron, synapse) , determine how the input is changed.

18

Simple Stimuli

Clicks, Flashes Steps Sine waves, tone bursts

slide-4
SLIDE 4

9/21/2011 4

The Real World: An arbitrary stimulus The Real World: An arbitrary stimulus

21

Linear Systems Analysis

A system is “linear” if it obeys rules of

  • -superposition
  • -scaling

Given two valid inputs, x1(t), x2(t) as well as their respective outputs then a linear system must satisfy

X Y 22 an impulse an impulse response h(t)

IN OUT

n convolutio d t x h t y   

) ( ) ( ) (    

  

  

  

k

k n x k h n y ) ( ) ( ) (

x(t)

zero at t ~= 0 1 at t=0 response to impulse

For linear systems……. 23 an impulse an impulse response h(t)

IN OUT

n convolutio d t x h t y   

) ( ) ( ) (    

  

  

  

k

k n x k h n y ) ( ) ( ) (

x(t)

zero at t ~= 0 1 at t=0 response to impulse

For linear systems……. 24 an impulse an impulse response h(t)

IN OUT

n convolutio d t x h t y   

) ( ) ( ) (    

  

  

  

k

k n x k h n y ) ( ) ( ) (

x(t)

zero at t ~= 0 1 at t=0 response to impulse

For linear systems…….

slide-5
SLIDE 5

9/21/2011 5

25 an impulse an impulse response h(t)

IN OUT

n convolutio d t x h t y   

) ( ) ( ) (    

  

  

  

k

k n x k h n y ) ( ) ( ) (

x(t)

zero at t ~= 0 1 at t=0 response to impulse

For linear systems…….

26

Convolution in words and pictures

Plot the impulse response h(k), and the flipped and shifted input signal, x(n-k),

  • n the same time axis.

Calculate the product. Calculate the area under the product curve. Plot the summed area as function of the signal shift.

jhu website

27

Fast Response, No Inhibition Fast Response, Inhibition

28

Slow Response, No inhibition

Excitation, stronger inhibition

29

Four Examples of Impulse Responses

30

Dynamic Response to Step Increase in Light Intensity

1) Start in constant, low level light. Step increase in intensity for 2 sec. Decrease back to previous level. 2) Decrement in light intensity generates the reverse (mirror image) Time invariant, linear system. Good fit to curve predicted from convolution

slide-6
SLIDE 6

9/21/2011 6

31

Convolution Result Predicts Dynamic Responses to Steps

Alternative methods for estimating h(t)

Response to impulse Response to noise Response to component sine waves

Ringach,D. and R. Shapley (2004)

  • Cog. Sci. 28:147

33

Using Sine Wave Stimuli

  • --Amplitude is multiplied by the

gain

  • --Phase is delayed or advanced

(add phase shift to sine wave) Amplitude and phase are different for different frequencies.

34

Do this for all relevant frequencies

Stimulate at all relevant frequencies with sinewave stimuli. Measure gain and phase

Frequency gain phase   1

35 36

slide-7
SLIDE 7

9/21/2011 7

37 Open circles: spike frequency recorded from eccentric cell A, while A is given a step increase in light. Closed circles: constant illumination

  • f ommatidium A

while providing the step increase in light in B.

Lateral Inhibition

light increase in area B

Lateral Inhibition also occurs in vertebrate retina

Receptive Field of Mammalian Ganglion Cell (S. Kuffler, 1953)

39

Lateral inhibition can be included in model

Linear cascade from one cell converts light to spike frequency. Spikes from one cell inhibit neighbors (lateral inhibition). Inhibition is mutual (varies with distance)

40

Steady State Response

What is the response to a point of light. Center (immediately over the eccentric cell): excitation. Surround (adjacent areas): inhibition.

41

In two dimensions

A Mexican Hat. Spatial impulse response.

42

Lateral Inhibition Enhances Edges

slide-8
SLIDE 8

9/21/2011 8

43

Prediction by Convolution

impulse response step of light result

Parallel Processing in Retina

Wassle, Heinz (2004) Nat. Rev. Neurosci. 5: 747-57

  • 1. rods

2 cones 3 horizontal 4 bipolar 5 amacrine 6 ganglion

cone triad Salamander retina on electrode array. Meister M, Pine J, Baylor DA (1994) Multi-neuronal signals from the retina: acquisition and analysis. J Neurosci Methods 51: 95–106. Tiger salamander Meister M, Pine J, Baylor DA (1994) Multi-neuronal signals from the retina: acquisition and analysis. J Neurosci Methods 51: 95–106. stimulus visualization

slide-9
SLIDE 9

9/21/2011 9

Record simultaneously responses from 61 electrode array. Characterize receptive field (spatial and temporal) of each ganglion cell using flickering checkerboard. For one ganglion cell, center circular spot on receptive field; add surround grating. Contribution from On Bipolar cells: APB added to ringers prior to recording (blocks the metabotropic glutamate receptor, knocking out “on” pahtway. Sharp electrodes for recording from amacrine cells. Stimulus: circular spot, 800 microns diameter (slightly larger than RF. Surround flickering grating. Intensity changes every 30 ms, pseudorandom level variation. Grating flickers every .9 s.

51

Lateral Inhibition

52

53

Mexican Hat

0 0 -1 0 0 0 -1 -2 -1 0

  • 1 -2 16 -2 -1

0 -1 -2 -1 0 0 0 -1 0 0

54

After convolution with mexican hat

slide-10
SLIDE 10

9/21/2011 10

55

Lessons from Visual Coding

1. The goal: understand sensory coding. Vision: example of “frequency code”. 2. Visual processing includes:

1. transduction, 2. encoding

3. Adaptation can be thought of as self inhibition. 4. Most sensory neurons behave as temporal filters: adaptation (tonic vs. phasic) 5. Linear systems analysis can also be used to describe spatial effects such as lateral inhibition. 6. Convolution can be used to predict responses to arbitrary stimuli.

The end