
SLIDE 1
Lessons Learned From Oregon’s Frontier
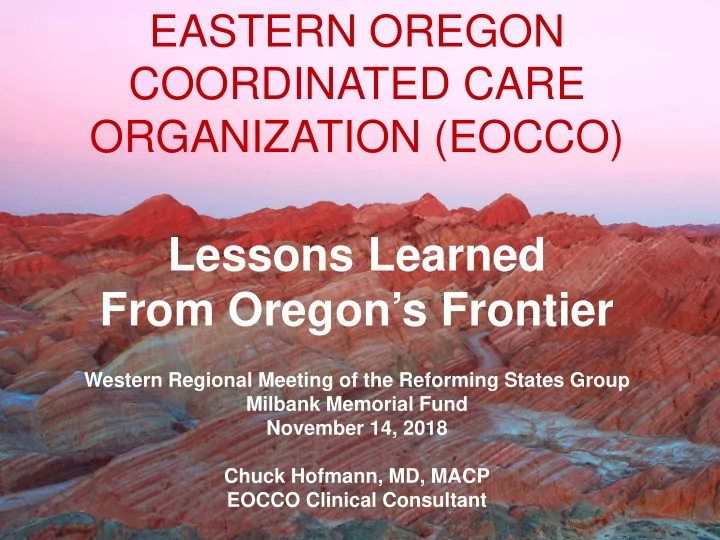
Western Regional Meeting of the Reforming States Group Milbank Memorial Fund November 14, 2018 Chuck Hofmann, MD, MACP EOCCO Clinical Consultant
Lessons Learned From Oregons Frontier Western Regional Meeting of - - PowerPoint PPT Presentation
EASTERN OREGON COORDINATED CARE ORGANIZATION (EOCCO) Lessons Learned From Oregons Frontier Western Regional Meeting of the Reforming States Group Milbank Memorial Fund November 14, 2018 Chuck Hofmann, MD, MACP EOCCO Clinical Consultant
Western Regional Meeting of the Reforming States Group Milbank Memorial Fund November 14, 2018 Chuck Hofmann, MD, MACP EOCCO Clinical Consultant
50,000 square miles (OR: 98,500 square miles) 195,000 residents (OR: 4,150,000 residents) 50,000 enrollees
– Moda Health – Greater Oregon Behavioral Health, Inc. – Good Shepherd Hospital, Hermiston – Grande Ronde Hospital, LaGrande –
–
–
– Eastern Oregon IPA, Umatilla County – Yakima Valley Farm Workers Clinic, FQHCs in Hermiston and Walla Walla, WA
– Hospital, Primary Care, Behavioral Health, Public Health, Local Elected Officials, & Lay Members
– 12 Local Community Advisory Councils (LCACs) – 1 per county – 1 Regional Community Advisory Council (RCAC) – Responsible for Community Health Assessments and Community Health Improvement Plans
– 12 Member committee composed of Primary Care, Behavioral Health, Public Health, Dental Health – Responsible for advising Board on clinical matters
– 10 Area Hospitals
– Primary Care Providers
– Additional Providers
*Includes Oregon, Idaho & Washington providers
MISSION: Operate within annual 3.4% fixed growth global budget rate framework in an environment of cost-based reimbursement to Type A hospitals, RHCs, and FQHCs while improving the health of our members
– Implementation of Value Based Payment System which includes shared savings – Enhanced Medical Home Payment Program
– LCAC Community Benefit Initiative grant program – Transformation Community Benefit Initiative grant program
– Participation voluntary – Quality bonus payments available to PCPs based on panel size – Enhanced monthly PMPM payments to certified medical homes based on tier status
– Two options for participation
– Quality bonus payments partially based on performance meeting specific EOCCO quality measure targets – Significant increase in monthly payments to certified medical homes
– Elimination of primary care fund
– Quality bonus payments entirely based on performance – To receive quality bonus payments, PCPs must participate in shared savings model – Participation remains voluntary
– Met 12 of 17 measures, received $1.9 Million-80% of available funding
– Met 13 of 17 measures, received $6.8 Million-100% of available funding
– Met 13 of 17measures, received $10.2 Million-100% of available funding
– Met 13 of 18 measures, received $10.1 Million-91% of available funding
– Met 14 of 17 measures, received $12.1 Million-101% of available funding
Claims Based Measures Clinical Quality Measures
Follow-up
Pressure
Experiencing Mental Illness Prevalence
Counseling for Children DHS custody and Adolescents
Chart Review Measures CCO-specific Measures
Initiative Percentage Quality Bonus Payments 30% Enhanced PCPCH Payments 40% LCAC Community Benefit Initiatives 6% Dental Care Organization Distribution 7% Transformation Grant Community Benefit Initiatives 10% Other Initiatives 7%
(through June 2018)
$28.4 Million
$26.6 Million
$27.9 Million
Benefit Initiative Grants $4.4 Million Total Re-Investments to date: $87.3 Million
– Primary Care Providers – Behaviorists – Community Health workers – Medical Assistants
– Rate reductions despite keeping growth rate <3.4%? – Increased CCO Responsibility for Social Determinants of Health – New organizational structures?
affect hospitals and the services they provide?
– In Oregon, Type A rural hospitals are legislatively required to be reimbursed on a cost-basis. – Hospitals have experienced decreased utilization, particularly in terms of inpatient and ED care. – Hospitals have purchased the majority of primary care practices which has allowed them to enjoy receiving primary care risk contract surpluses and quality bonuses.