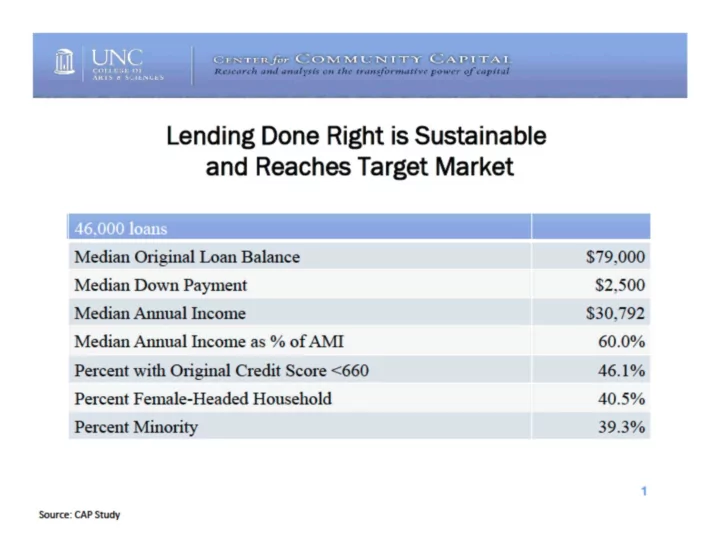

UNC Center for Community Capital Logo Research and analysis on the transformative power of capital College of Arts & Sciences for UNC Lending Done Right is Sustainable and Reaches Target Market 46.000 loans Median Original Loan Balance ^ | $79,000 Median Down Payment $2,500 Median Annual Income $30,792 Median Annual Income as % of AMI 60.0% ^ H 46.1% Percent with Original Credit Score <660 Percent Female-Headed Household 40.5% ^ H 39.3% Percent Minority Source: CAP Study
UNC Center for Community Capital COLLEGE OF ART S & S C I E N C E S Research and analysis on the transformative power of capital Lending Done Right Leads to Wealth Building Median annualized CAP house price appreciation since origination stands at 2%, with annualized return-on-equity at 29%. This appreciation translates into median wealth gains of $21,000, or about 72% of borrower annual income at the median. The graph shows median total equity accumulated by CAP participants in January of 2000 of between $2,000 and $3,000. This rises very smoothly to about $33,000 at the end of 2006. The median total equity accumulated by CAP participants then falls to about Equity gains have $22,000 in October of 2008 before rebounding to around $24,000 in July of 2010. The been mostly retained, despite the financial crisis graph is sourced to Self-Help and Fannie Mae. Research Funded by the Ford Foundation Source: Self-Help; Fannie Mae
UNC Center for Community Capital COLLEGE OF ARTS & S C I E N C E S Research and analysis on the transformative power of capital Lending Risks Are Manageable (90 days+ or in foreclosure) by Mortgage Type This slide contains a title and a graph plotting the percent of loans that are 90 days or more delinquent or in foreclosure, for six types of loans over time (from the first quarter of 2006 through the fourth quarter of 2010: 1) Subprime Adjustable Rate Mortgages; 2) Subprime Fixed Rate Mortgages; 3) Prime Adjustable Rate Mortgages; 4) Prime Fixed Rate Mortgages; and 5) FHA Mortgages CAP Mortgages. Title of the graph is Lending Risks Are Manageable, 90 Days Plus or in Foreclosure by Mortgage Type. From the graph: Subprime Adjustable Rate Mortgages had the highest 90 days-plus and delinquent rate of all six mortgage types. Subprime Adjustable Rate Mortgages start off with a delinquency+ rate of around 6% in the first quarter of 2006. This rose to in excess of 42% in the fourth quarter of 2009 before dropping back to around 38% in the fourth quarter of 2010. Subprime Fixed Rate Mortgages had the second highest 90 days-plus and delinquent rate of all six mortgage types. Subprime Fixed Rate Mortgages start off with a delinquency+ rate of around 6% in the first quarter of 2006. This rose to around 21% in the fourth quarter of 2009 before dropping back to around 20% in the fourth quarter of 2010. Prime Adjustable Rate Mortgages started off with among the lowest 90 days-plus and delinquent rate of all six mortgage types; however, by the middle of 2008 they had the third highest 90 days-plus and delinquent rate of the six mortgage types. Prime Adjustable Rate Mortgages start off with a delinquency+ rate of less than 1% in the first quarter of 2006. This rose to around 18% in the fourth quarter of 2009 before dropping back to around 16% in the fourth quarter of 2010. Prime Fixed Rate Mortgages had the lowest 90 days-plus and delinquent rate of all six mortgage types. Prime Fixed Rate Mortgages start off with a delinquency+ rate of less than 1% in the first quarter of 2006. This rose to around 5% in the fourth quarter of 2009 before dropping back to around 4% in the fourth quarter of 2010. FHA Mortgages started off with among the highest 90 days-plus and delinquent rate of all six mortgage types; however, by the start of 2010 they had the second lowest 90 days-plus and delinquent rate of the six mortgage types. FHA Mortgages start off with a delinquency+ rate of around 6% in the first quarter of 2006. This rose to around 9% in the fourth quarter of 2009 before dropping back to around 8% in the fourth quarter of 2010. CAP Mortgages start off with a delinquency+ rate of just over 2% in the first quarter of 2006. This rose to around 10% in the first quarter of 2010 and it had stayed around 10% for all of 2010. This 90 days-plus and delinquent rate for CAP mortgages is well below that for either of the two types of subprime mortgages and also well below that of Prime Adjustable Rate mortgages. The graph is not sourced.
UNC CENTER for COMMUNITY CAPITAL Research and analysis on the transformative power of capital. COLLEGE OF ARTS & SCIENCES Factors Contributing to Sustainability Safe product 30 year FRM are predictable and longer loan life, even with low downpayment Careful underwriting: ability to pay, income documentation, etc. Preventive and smart servicing matters • Odds that a late repaying borrower will manage to catch up can vary as much as 60% between servicers Supportive secondary market functions a Equal access to capital markets - no dual markets • Pooling of risks: geography, borrower, other • Transparency and standardization • Portfolio functions
Recommend
More recommend