
SLIDE 1
Lecture 19/Chapter 16
Probability & Long-Term Expectations
Expected Value More Rules of Probability Tree Diagrams
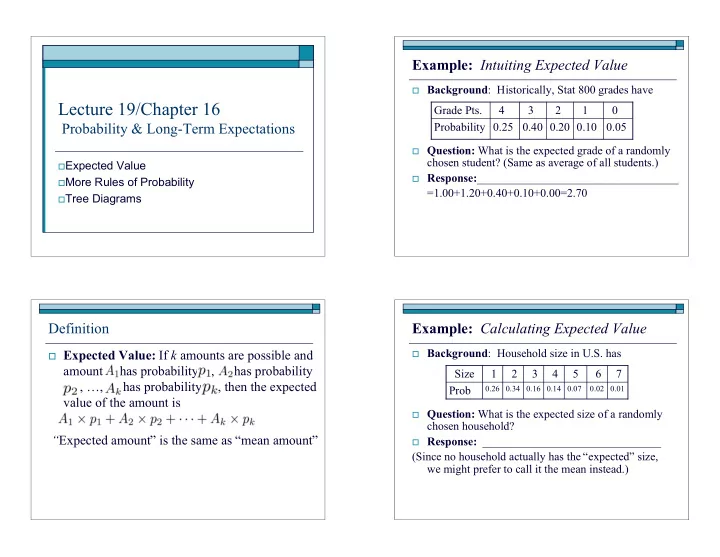
Example: Intuiting Expected Value
Background: Historically, Stat 800 grades have Question: What is the expected grade of a randomly
chosen student? (Same as average of all students.)
Response:___________________________________
=1.00+1.20+0.40+0.10+0.00=2.70 0.05 0.10 0.20 0.40 0.25 Probability 1 2 3 4 Grade Pts.
Definition
Expected Value: If k amounts are possible and
amount has probability , has probability . , …, has probability , then the expected value of the amount is “Expected amount” is the same as “mean amount”
Example: Calculating Expected Value
Background: Household size in U.S. has Question: What is the expected size of a randomly
chosen household?
Response: _______________________________
(Since no household actually has the “expected” size, we might prefer to call it the mean instead.)
0.01 0.02 0.07 0.14 0.16 0.34 0.26