
SLIDE 1
Lecture 11/Review Chapter 8
Normal Practice Exercises
Strategies to Solve 2 Types of Problem Examples
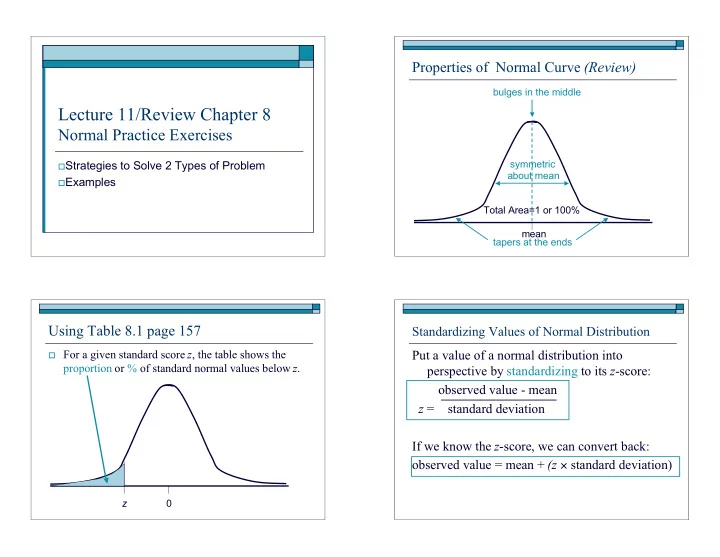
Properties of Normal Curve (Review)
mean symmetric about mean bulges in the middle tapers at the ends Total Area=1 or 100%
Using Table 8.1 page 157
For a given standard score z, the table shows the
proportion or % of standard normal values below z.
z
Standardizing Values of Normal Distribution Put a value of a normal distribution into perspective by standardizing to its z-score:
- bserved value - mean
z = standard deviation If we know the z-score, we can convert back:
- bserved value = mean + (z standard deviation)