
Lec Lectur ure 3: e 3: Magnetocaloric ma materials
Karl G. Sandeman ESM 2013
Overview of Lecture 3
- 1. Examples of tricritical materials
- 2. What are the limits of magnetocaloric performance?
- 3. An introduction to several room temperature magnetocaloric materials
- 4. Some words on measurement
- 5. An example of material-device integration: the SSEEC project
- 6. Where else to look for caloric effects?
- 7. Conclusion
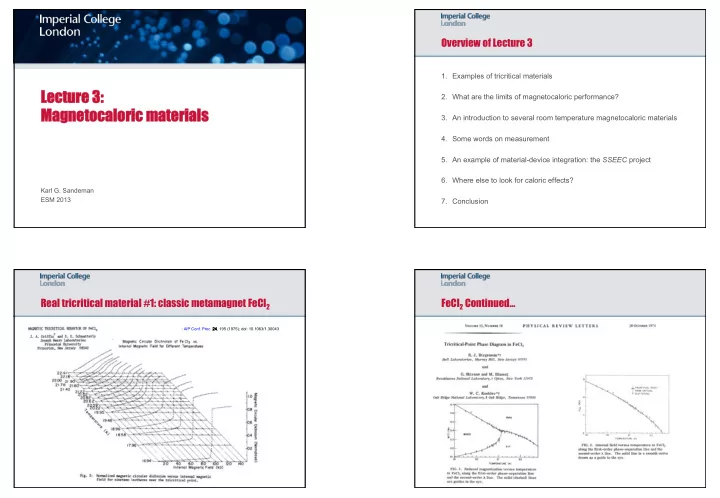
Real tricritical material #1: classic metamagnet FeCl2
197 the first order transition. The second order transi- tion is located by a maximt~ in the susceptibility at the critical external field. The behavior depicted in Fig. 2 is accentuated in
- Fig. 3, which illustrates the dichroism as a function
- f internal magnetic field for the same nineteen iso-
- therms. The transformation to internal magnetic field
was accomplished by least squares fitting the dichroism in the mixed phase in Fig. 2 to determine the demagne- tization factor, and ntmlerically computing the internal magnetic field at each data point according to where H is the internal magnetic field, and H E is the external magnetic field. The demagnetization factor was determined for eleven temperatures between 9.95 K and 19.48 K, and was found to deviate from the average by at most 2%, thus illustrating that the factor of proportionality between dichroism and magnetization is temperature independent. As a function of temperature the internal field dependence of the dichroism illus- trates the physical behavior of the tricritical system. At 16.94 K the simultaneous spin-flip of the large blocks of magnetic moments in the antiparallel layers is manifested by a discontinuity in the dichroism at the critical internal field. As the temperature is increased, thus reducing the ferromagnetic coupling within the layers, the discontinuity in the dichroism becomes smaller. This behavior is illustrated by iso- therms at 18.58K, 19.48K, and 20.22K. At tempera- tures beginning with 20.82 K the transition is second
- rder,
for the finite discontinuity occurring at the critical field at low temperatures is replaced by a continuous dichroism. This continuous behavior above T t is associated with the flipping one-by-one of the magnetic moments in the antiparallel layers. The line of these second order transitions is traced out by the susceptibility maximt~ at the critical internal field.
- Fig. 4 illustrates the normalized critical magne-
tic circular dichroism versus temperature. In the
., bbO,Q 10 i~ 6im ID22.41 2200 21 .906~ C 21.78 21. 21.42 21 °,,.,*"
III first order region the two data points for each temp- erature depict the dichroiam at the onset and termina- tion of the vertical discontinuity depicted in Fig. 3. The two branches are denoted by M' and M-. In the second order region the single data point at each temp- erature denotes the value of the dichreism on the line, and this branch is labeled by M
- I. The tricriti-
cal point occurs at T~ -- 20.79 -+ 0. ii K and )4 _ = 0.38 _+ 0.01. There are several interesting feature~ of the data in Fig. 4. First, both branches in the first
- rder region appear to approach the tricritical point
- linearly. The tricritical point exponents associated
with the total magnetization are described by : A+(cr
t -T)/Tt) B÷ and : ((T t -T)/T~8-. I0 From the data in Fig. 4 we obtain 8+ = 1.03+0.05 for 8.3xi0
- s <- (Tt-T)/T
t < 1.06x10
- l
and 8_ = 1.13+0.14 for 8.3x10 "3 < (T t -~)/T t < 6.3 x 10 "z . According to a Landau analysis these expo- nents are given by B+ = B. = 1.00. Secondly, the slopes of the branches M + and Ml at the tricritical point are not equal. W e
- btain dCM+/N~/d(T/Tt) --
7.0 +0.3 and d(M~/Mt)/dCr/Tt) = 4.1 -+0.2, whereas a Landau analysis predicts that the slope of the total magnetization on the upper branch of the first order transition should be equal to that on the ~ line at the tricritical point. The internal critical magnetic field versus temp- erature phase diagram is illustrated in Fig. S. This figure is a plot of the critical internal field at each temperature at which the spin-flip transition occurs in
- Fig. 3. This data illustrates that at the tricritical
point the first order branch of this phase diagram intersects the I branch with a continuous slope. A Landau description predicts that the slope and magni- tude of these branches should be continuous at the tri- critical point, and such behavior appears to be the case in Fig. 5. Megnetic Circular Dichroism of Fe CI~ vs. Internol Megnetic Field for Different Temperatures
~10 OD20.6 2 .... >o,~ 19.9~ \ ~°e" 19.4
%.
t~ %
,8.96
1856
. \ ~ ...A....~.-. "" "\ \\ \
OIIO O I~O1010 1QOOOIOIOQ 00Q00119 jOIO O01~lOIDI~atl igll2.0 40 6.0 80 I00 12D Internal Mognetic Field (kG) 10 08 o
O Q06" N 0.4 ~ B
- .2
14.0
- Fig. 3: Normalized magnetic circular dichroism versus internal magnetic
field for nineteen isotherms near the tricritical point. 195 ABSTRACT Magneto-optic measurements of the tricritical behavior of FeCI2 are presented. These measurements utilize the magnetic circular dichroism of a near infrared absorption of the Fe ++ ions in order to deter- mine the total magnetization as a function of tempera- ture and magnetic field near the tricritical point. The resultant description of the magnetic tricritical behavior is consistent with most predictions of a classical Landau analysis, and is found to exhibit a remarkable similarity with the tricritical behavior of 3He-~He mixtures. INTRODUCTION MAGNETIC TRICRITICAL BEHAVIOR OF FeCl 2
- J. A. Griffin* and S. E. Schnatterly
Joseph Henry Laboratories Princeton University Princeton, New Jersey 08540 critical temperature Tt, above which the transition is second order up to the Neel temperature T
- N. The point
in the metamagnetic phase diagram at which this field- induced transition chsnges from first to second order has been labeled a tricritical point3, and it is the cooperative behavior associated with this special point that is responsible for the current interest in meta- magnetic systems. Optical techniques have frequently been utilized as a probe for studying many aspects of magnetism and magnetic materials. One aspect which has recently received considerable interest is the field-dependent behavior of highly anisotropic antiferromagnetic sys- tems and their resultant tricritical cooperative phe- nomena. In this paper we will describe the applica- tion of magneto-optic techniques to the study of the magnetic tricritical behavior in FeCl 2 . Although we have observed the effects of magnetic ordering in measurements of optical absorption and of magnetic circular dichroism from the near ultraviolet to the near infrared, we will concentrate here only on the infrared circular dichroism I . These measurements, which utilized the dichroism of an absorption band of the Fe ++ ion, are used to monitor the temperature and magnetic field dependence of the total magnetization. The optical data is then used to construct magnetic phase diagrams of total magnetization versus tempera- ture and of internal magnetic field versus temperature, and to extract tricritical point exponents associated with the total magnetization. The resultant tricriti- cal behavior of FeCI 2 exhibits a striking similarity with that of 3He-~He mixtures, and is found to agree in most respects with the predictions of a classical Landau analysis. METAMAQ~TIC BEHAVIOR Metamagnetic FeCI_ is a highly anisotropic anti- . ferromagnet which conslsts of hexagonal layers of Fe ++ magnetic moments. 2 Within these layers there is a strong ferromagnetic exchange coupling which aligns the magnetic moments in a parallel arrangement, and between the layers there is an antiferromagnetic coupling. The
- verall magnetic order is that of antiferromagnetically
aligned ferromagnetic layers. The magnetic moments are strongly confined to the hexagonal c axis (perpendicu- lar to the layers) by an anisotropy energy that exceeds both the ferromagnetic and antiferromagnetic exchange
- energies. The fact that this anisotropy exceeds the
antiferrc~mgnetic exchange and that there is ferromag- netic coupling within the layers results in the rather interesting field-dependent behavior. In the presence of a sufficiently strong magnetic field applied perpendicular to the layers, there is an antiferromagnetic to paramagnetic phase transition. Due to the strong anisotropy this field-induced transi- tion involves a spin-flip in which the initially anti- parallel planes flip directly to the paramagnetic con- figuration, without the spin-flop phase present in many antiferromagnets. Due to the ferromagnetic coupling within the layers this spin-flip transition is first
- rder at finite temperature, and it results in a finite
discontinuity in the total magnetization. The first
- rder nature of the transition persists up to the tri-
EXPERIMENTAL TE[}]NIQUE Magnetic circular dichroism is the field-induced difference in absorption coefficients for left and right circularly-polarized light for a geometry in whic~ the magnetic field and incident beam are paral- lel.~ Measurements of the infrared dichroism of FeCl2 were made by placing the sample in the bore of a super- conducting solenoid with optical access parallel to the magnetic field. The sample, a flat plate, was mounted so that its hexagonal c axis was parallel to the mag- netic field and was masked in order that the incident beam was limited to the central portion of the plate, across which the internal magnetic field is homogeneous. The incident monochromatic beam was passed first through a linear polarizer, next through a rotating phase plate, next through a mechanical chopper, and finally through the sample. The suitably analyzed intensity at the detector is proportional to
- 2~Ld
- 2~Rd
- e
- 2%d
- 2C~.Rd
(i)
e + efrom which the circular dichroism MCD(X,T,~ - %- % (z) is obtained. The resolution of the optical system used in the experiment was approximately 0.2% of the satu- rated paramagnetic dichroism, and this resolution has been extended to approximately 0.05% using optical bridge techniques. The temperature of the sample was carefully con- trolled. For this purpose the sample was placed in a cylindrical holder equipped with optical windows on each end and which was filled with ~He exchange gas. No effects due to sample heating by the incident beam were found to occur. The temperature of the holder was measured by a calibrated four-wire germanit~n resistance thermometer and an ac resistance bridges before and after each magnetic field scan. In order to control the sample holder temperature during the field scan, a magnetic field-independent SrTiO 3 capacitance thermo- meter was used in an ac capacitance bridge temperature
- controller. 6 This technique eliminates the coupling of
temperature and magnetic field which occurs due to the magnetoresistance present in germanit~a or carbon resis- tance thermometers. Using this scheme, the sample temperature was constant to approximately 3 mK along each isothermal field scan. EXPERIMF2CrAL RESULTS
- Fig. 1 illustrates the optical absorption of FeCI
2 in zero magnetic field at four temperatures. The low- est optical transition occurs at approximately 1.45 microns, and is a phonon-assisted electric dipole tran- sition between the cubic field split components, the lower ST2g and the upper 5E~, of the free ion SD term. The doublet structure arise~ from the Jahn-Teller effect in which the two-fold orbital degeneracy of the SE level is lifted by even-parity phonons.7 This tra~si-
- FeCl2 Continued…
Vox.UMs 55, NUMszR 18 28 Qcrosza 1974
- Chem. Hev. 55, 745 {1955). In their work with the Mul-
liken electronegativity scale, Pritchard and Skinner also defined s- and p-orbital contributions to the elec- tronegativity.
- H. Jagodzinski,
Neues Jahrb. Mineral. , Monatsh.
XO, 49 {Z954).
- 6P. Lawaetz,
- Phys. Hev. B 5, 4039 {1972).
~E. Mooser and W. B.Pearson, Acta Crystallogr. 12, 1015 (1959).
J.A. Van Vechten,
- Phys. Hev. F87, 1007 {1969).
We are grateful to J. C. Phillips
for pointing this
- ut to us.
Tncntical-Point Phase Diagram in FeCI, R, J. Birgeneau*g
Bell Laboratories, Murray
Hi&l, Nezo Jersey 07974
- G. Shirane
and M. Blumef, Brookhaven National I. aboratory,
g Upton, New Fork 2'1973
- W. C. Koehler*g
Oak Ridge ¹tional I. aboxatoxy, 5 Oalz Ridge, Tennessee
37830 (Received 15 July 1974) Detailed measurements
- f the magnetization
and sublattice magnetization
- f I"eCl& in a
magnetic field have been performed by use of polarized- and unpolarized-neutron-diffrac- tion techniques. The phase diagram so determined is found to bear a close resemblance to that of 3He- He mixtures near the tricritical point although there are a number
- f im-
portant differences which seem to require, at the minimum, an extension of present theo- ries of tricritical phenomena. In 1935 and 193V Landau' gave a phenomenolog-
ical theory for thermodynamic systems exhibit-
ing a line of first-order transitions going over continuously into a line of second-order
transi- tions. Three decades later, Graf, Lee, and Rep-
py' showed that just such a situation
- ccurs in
'He-4He mixtures where, at the junction point, the superfluid
- A. line goes continuously
into the phase-separation line. Shortly thereafter, Grif- fiths' considered in more detail the general 'He- 4He phase diagram and he showed that the junc- tion point actually occurs at the intersection
- f
three lines of second-order transitions.
He thence proposed the name trinitica/point
for this special point on the phase diagram. Grif- fiths further suggested that tricritical points
might occur in a wide variety
- f physical
sys- tems and,
in particular, in metamagnets such as FeCl,." In this case it is proposed that one has a simple isomorphism between thermodyna- mic variables with,
for example, magnetization
M(H, T)- X, the 'He concentration, and sublat-
tice magnetization
M, (H, T)- i/I, the superfluid
- rder parameter.
In this Letter we report a de- tailed neutron-diffraction study of FeCL, in a magnetic field. As we shall show, FeC1, does indeed exhibit tricritical behavior and, further- more, the phase diagram around the tricritieal point bears a close resemblance to that of 'He- 4He mixtures. There are, however, a number
- f quantitative
discrepancies with theory which necessitate both an extension
- f the existing
theories together with further experiments. %e consider first the magnetic properties
- f
FeC1„ the experimental
technique, and the sali- ent results. We shall then discuss the current theoretical predictions in the context of the re- sults. The crystal structure, magnetic proper- ties, and critical behavior
- f FeC1, in zero mag-
netic field have been extensively discussed by Birgeneau, Yelon, Cohen, and Makovsky. ' From the vantage point of critical phenomena, FeCl, may be viewed as being composed
- f hexagonal
sheets of ferromagnetically coupled 5 =1 Ising spins with successive planes weakly coupled anti- ferromagnetically. At low temperatures as a function
- f increasing
internal field H , (we shall. assume that all fields are applied along the crys- talline e axis), FeC1, undergoes a first-order transition from an antiferromagnetic (A/f) to a
Vox.UMs 55, NUMszR 18 28 Qcrosza 1974
- Chem. Hev. 55, 745 {1955). In their work with the Mul-
liken electronegativity scale, Pritchard and Skinner also defined s- and p-orbital contributions to the elec- tronegativity.
- H. Jagodzinski,
Neues Jahrb. Mineral. , Monatsh.
XO, 49 {Z954).
- 6P. Lawaetz,
- Phys. Hev. B 5, 4039 {1972).
~E. Mooser and W. B.Pearson, Acta Crystallogr. 12, 1015 (1959).
J.A. Van Vechten,
- Phys. Hev. F87, 1007 {1969).
We are grateful to J. C. Phillips
for pointing this
- ut to us.
Tncntical-Point Phase Diagram in FeCI, R, J. Birgeneau*g
Bell Laboratories, Murray
Hi&l, Nezo Jersey 07974
- G. Shirane
and M. Blumef, Brookhaven National I. aboratory,
g Upton, New Fork 2'1973
- W. C. Koehler*g
Oak Ridge ¹tional I. aboxatoxy, 5 Oalz Ridge, Tennessee
37830 (Received 15 July 1974) Detailed measurements
- f the magnetization
and sublattice magnetization
- f I"eCl& in a
magnetic field have been performed by use of polarized- and unpolarized-neutron-diffrac- tion techniques. The phase diagram so determined is found to bear a close resemblance to that of 3He- He mixtures near the tricritical point although there are a number
- f im-
portant differences which seem to require, at the minimum, an extension of present theo- ries of tricritical phenomena. In 1935 and 193V Landau' gave a phenomenolog-
ical theory for thermodynamic systems exhibit-
ing a line of first-order transitions going over continuously into a line of second-order
transi- tions. Three decades later, Graf, Lee,
and Rep- py' showed that just such a situation
- ccurs in
'He-4He mixtures where, at the junction point, the superfluid
- A. line goes continuously
into the phase-separation line. Shortly thereafter, Grif- fiths' considered in more detail the general 'He- 4He phase diagram and he showed that the junc- tion point actually occurs at the intersection
- f
three lines of second-order transitions.
He thence proposed the name trinitica/point
for this special point on the phase diagram. Grif- fiths further suggested that tricritical points
might occur in a wide variety
- f physical
sys- tems and,
in particular, in metamagnets such as FeCl,." In this case it is proposed that one has a simple isomorphism between thermodyna- mic variables with,
for example, magnetization
M(H, T)- X, the 'He concentration, and sublat-
tice magnetization
M, (H, T)- i/I, the superfluid
- rder parameter.
In this Letter we report a de- tailed neutron-diffraction study of FeCL, in a magnetic field. As we shall show, FeC1, does indeed exhibit tricritical behavior and, further- more, the phase diagram around the tricritieal point bears a close resemblance to that of 'He- 4He mixtures. There are, however, a number
- f quantitative
discrepancies with theory which necessitate both an extension
- f the existing
theories together with further experiments. %e consider first the magnetic properties
- f
FeC1„ the experimental
technique, and the sali- ent results. We shall then discuss the current theoretical predictions in the context of the re- sults. The crystal structure, magnetic proper- ties, and critical behavior
- f FeC1, in zero mag-
netic field have been extensively discussed by Birgeneau, Yelon, Cohen, and Makovsky. ' From the vantage point of critical phenomena, FeCl, may be viewed as being composed
- f hexagonal
sheets of ferromagnetically coupled 5 =1 Ising spins with successive planes weakly coupled anti- ferromagnetically. At low temperatures as a function
- f increasing
internal field H , (we shall. assume that all fields are applied along the crys- talline e axis), FeC1, undergoes a first-order transition from an antiferromagnetic (A/f) to a
VOLUME 33, NUMBER 18
PHYSICAL REVIEW LETTERS
28 OCTOBER 1/74 paramagnetic
(para) state. Above a critical tem- perature
- f -21 K, however,
the A/f-para tran- sition appears to become continuous.
4 The Noel
temperature in zero field is -23.6 K. ln a real experiment, it is, of course, the applied field, H pp 9 which is varied.
Hill, and Hpp
are rel ated by"
- H. ,=H„, -4~mS(H. „r),
where M(H „T)is the magnetization and N is the demagnetizing
factor.
Unfortunately, in ex- periments reported to date' the samples have been highly nonellipsoidal in shape thence giving
rise to a large distribution
in internal fields. Hence, no detailed information could be obtained about the tricritical behavior. The experiments reported here were performed
- n a triple-axis
spectrometer at the Brookhaven National Laboratory high-flux beam reactor. The sample was an ellipsoidal platelet
- f dimen-
sions 2.4x1.1&&0.09 cm' with the crystalline c axis perpendicular to the flat face. The crystal was masked with cadmium so that only the cen- ter 25% was illuminated with neutrons. The es- timated spread in the demagnetizing field from geometrical effects was thus less than 10 0 at the tricritical point. The crystal was mounted with its (010) axis vertical in a variable-tem- perature cryostat and the cryostat in turn was mounted
- n a conventional
magnet with the field in the horizontal plane directed along the sample (00l) direction. The sublattice magnetization could be determined in the usual fashion from the intensity at the (201) superlattice position while the magnetization was determined from the flipping ratio of polarized neutrons at the (300) nuclear reflection. This simultaneous
access to
both the ordering and nonordering densities
rep- resents a considerable advantage
- f the neutron-
scatte ring technique. The experiments consist mainly
- f a series of
scans either in H, at a fixed temperature
- r
vice versa.
At low temperatures as H,
is in- creased the superlattice intensity I(2013 decreas- es gradually
up to a critical field H,
(1) at which point there is a discontinuity in dI/dH, signal-
ing a first-order transition into the mixed A/f- para state. The intensity,
I(201), then decreas- es linearly
with increasing H, up to a critical field, H,P&(2), at which point I(201) vanishes and the crystal enters a homogeneous paramagnetic
state. The field difference, H, (2) — H, (1), is just the demagnetizing-field difference
4m% &&[1II(H,(2), T) —
M(H. ,(l), T)] for the two states.
0.7 0. 6 0.5 %04 0.3 0.2 0.
1 i20
TEMPERATURE (Kj
22
- FIG. 1. Reduced magnetization
versus temperature in FeCl2 along the first-order phase-separation line
and the second-order
- A. line.
The solid (dashed) lines are guides to the eye. As the temperature
is increased
the mixed- phase region decreases in size until beyond about
21.15 K the transition
appears to be of second or- der. Measurements
- f the magnetization
along the phase boundaries so determined may then be carried
- ut with the use of polarized
neutrons. We consider here only the results around the tri- critical point/
Happ
10 200 0, T, = 21.15 K. The normalized magnetization as a function
- f tem-
perature along the phase boundaries is shown in
- Fig. 1. It is immediately
evident that the Feel, phase diagram does indeed bear a striking re- semblance to the X-T phase diagram in 'He- He mixtures. We shall discuss this correspondence in detail below. The thermodynamic variable conjugate to the magnetization M(H „T)is the. internal field H, Using Eq. (1) and the results shown in Fig. 1 one may immediately construct the H. ,-T diagram. By definition, the upper and lower lines of the phase-separation curve must collapse
- nto a single line.
The resultant
- H. ,-T
phase diagram is given in Fig. 2. The phase- separation line is seen to be continuous with the
- A. line through
the tricritical point. As an additional check, we also monitored the strength
- f the A/f critical fluctuations
along the upper phase boundary, at the position (1.98, 0,
0.99), just off the (2, 0, 1) Bragg peak.
The criti- cal-scattering intensity is found to decrease gradually as one moves up the
- A. line.
However at T =21.15+0.1 K there is a distinct break in the slope with the critical scattering then decreas- ing rapidly in intensity with further decrease in temperature. This is a clear signature
- f the
crossover from a second- to a first-order tran- 1099
Vox,UME 33, NUMssR 18
P8YSI GAI, RK VI K W I.KITER S
28 OcroazR 19?4
1.0 0.7 cU04
O0.2
&i0.1 0.07
I0.002 0.004 0.007 0.01 0.02 0.04 0.07 0.
10.2
1 —T/ Tt l0.4 0.7
3.0 6 1920
21 TEMPERATURE (K)22
- FIG. 3. Square of the normalized
sublattice magneti- zation versus reduced temperature along the A/f side
- f the first-order
line. Here
T& —
—
21.15 K. The solid
line corresponds to the power law, Eq. (2) .
- FIG. 2. Internal
field versus temperature in FeC12 along the first-order phase-separation line and the second-order
- A. line.
The solid line is a smooth curve drawn as a guide to the eye. sition and it thus serves to locate independently the tricritical point at T=21.15 K, II,
=10200
0 for our sample.
We have also carried
- ut a wide variety
- f
measurements
- f the staggered
magnetization M, (H, T) along various paths in the H, -T plane in order to test the concept of smoothness. These results are discussed in detail in a separate pub-
- lication. ' We consider here explicitly,
however, the discontinuity in the sublattice magnetization,
DM„across the first-order
phase-transition line. This should exhibit characteristic
tricriti- cal behavior
with respect to the tricritical tem- perature
T,. The results
- f these measurements
are shown
in log-log form in Fig. 3. Here we take T, =21.15 K, the value deduced both from
- Fig. 1 and from the critical-scattering
measure- ments discussed above. Over the reduced-tem- perature range 4x10 '&1 —T/21. 15&2x10 ' the square of the normalized sublattice magnetiza- tion is found to follow the simple power law (SM,/M, )' = 1.5(1 —T/21. 15)'". (2) We now discuss the results given in Figs. 1-3 in the context of the current theories
- f tricriti-
cal phenomena. It has been demonstrated'
by
Riedel and Wegner and by Bausch that for lattice dimensionality
d& 3 the tricritical point ought to be characterized by classical critical exponents.
For d =3 the classical power laws should be modi- fied by logarithmic correction terms.
In the M-
T plane the Landau theory predicts that the three phase-boundary lines will approach the tricriti- cal point linearly, that is, P=1, with the second-
- rder
- A. line joining onto the paramagnetic-phase-
separation line with no discontinuity in slope. From Fig. 1 it is evident that this latter predic- tion is explicitly contradicted in FeCL„a similar result is found in 'He-'He mixtures. The upper two lines in Fig. 1 do seem to approach the tri- critical point linearly; however, the A/f first-
- rder line deviates
considerably from linearity up to at least 20.9 K, that is 1 —T/T, =0.01. In- deed over the reduced-temperature range 0.1
& 1 —T/T, & 0.01 an exponent P„-0.
36 rather than 1 seems to be appropriate. Along the first-
- rder line the Landau theory also predicts
that the discontinuity in the sublattice magnetization should
- bey the power law hM, 'cc 1 —
T/T„ that is 2P, =1, compared
to our result,
- Eq. (2), 2P,
=0.38. These exponents are accurate,
- ver the
temPerature range covered, to about
10%%uc. Thereappears, therefore, to be a serious conflict be- tween the classical theory
and experiment along the A/f first-order line for both the magnetiza- tion and the sublattice magnetization, unlike the
case of He'-He' mixtures. ' There is, of course,
always the possibility that for some as yet un- known reason the asymptotic behavior is only at- tained very close to T, along this particular
- path. '
We should note, however, that along all other paths across the
- A. line the sublattice
magnetiza- tion exhibits the predicted power-law behavior for 1 — T/T, or 1-H/H,
& 10 ', whereas
here we have a significant discrepancy at 1 —T/T, -4 &10 '. Clearly, this requires further experimen- tal and theoretical study. Unfortunately,
any significant improvement
- f our neutron
measure- ments of the phase-separation line near T, is un- likely; the first-order transition manifests it- self as a discontinuity in dI(201)/dH,
and this point becomes very difficult to locate accurately beyond 21.0 K. However,
it may be possible to