
SLIDE 1
Learning Human Preferences and Perceptions From Data
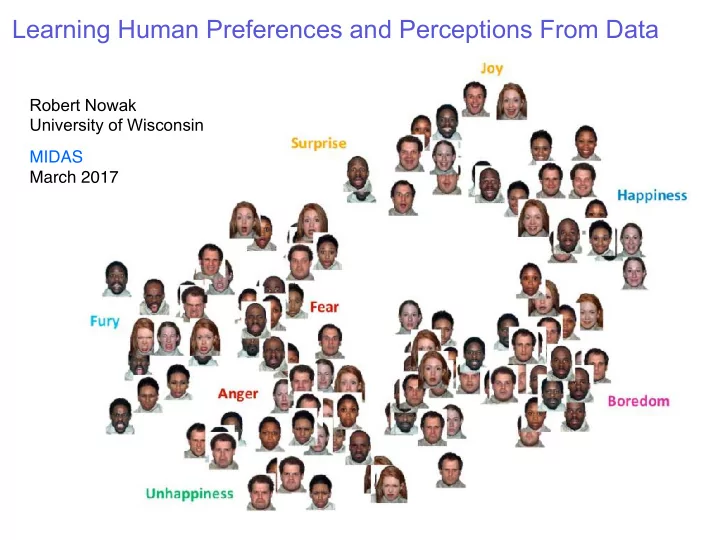
Robert Nowak University of Wisconsin MIDAS March 2017
Learning Human Preferences and Perceptions From Data Robert Nowak - - PowerPoint PPT Presentation
Learning Human Preferences and Perceptions From Data Robert Nowak University of Wisconsin MIDAS March 2017 metric learning rating systems www.newyorker.com/cartoons/vote https://edpsych.education.wisc.edu/
Robert Nowak University of Wisconsin MIDAS March 2017
http://pulse.media.mit.edu
www.newyorker.com/cartoons/vote
“active machine learning” machine decides which data people should label next
Help health experts train machines to interpret electronic health records Help scientists adaptively select experiments to determine which genes are the most important
Lalit Jain Kevin Jamieson
Bob Mankoff Cartoon Editor, The New Yorker
“Flawless execution!
www.newyorker.com/cartoons/vote each week: 10-20K participants 500-1000K ratings
1 2 3 n-1 n
1 2 3 n-1 n
1 2 3 n-1 n keep collecting an equal number of ratings for each caption ... until there is a statistically significant winner
1 2 3 n-1 n
1 2 3 n-1 n using the same logic: we can stop rating captions with upper confidence bounds that are less than the greatest lower confidence bound
successive elimination focuses rating process on the top captions
# ratings collected (1000s) Prob( best caption in top 10 )
not funny 1 somewhat funny 2 funny almost all captions have low average rating less rating variances typically much less than 1 sharper confidence interval bounds based
another 2X to 3X improvement ! # ratings collected Prob( best caption in top 10 )
Tim Rogers
is the emotion in i more like j k ?
Blake Mason
identifying the visual features that students focus on (and miss) informs the design of tutoring systems Lalit Jain
# hydrogen # oxygen
# carbon # hydrogen # oxygen
visualization: two-dimensional metric representation is easy to interpret
Advances in Neural Information Processing Systems (NIPS), 2010.
Kunapuli, Gautam, and Jude Shavlik. "Mirror descent for metric learning: A unified approach." Joint European Conference on Machine Learning and Knowledge Discovery in Databases. Springer Berlin Heidelberg, 2012.
# carbon # hydrogen # oxygen
implication: students don’t pay much attention to number of oxygen atoms
Ying, Yiming, Kaizhu Huang, and Colin Campbell. "Sparse metric learning via smooth optimization." Advances in neural information processing systems. 2009. Rosales, Rómer, and Glenn Fung. "Learning sparse metrics via linear programming." Proceedings of the 12th ACM SIGKDD international conference on Knowledge discovery and data mining. ACM, 2006. Atzmon, Yuval, Uri Shalit, and Gal Chechik. "Learning sparse metrics, one feature at a time." Journal of Machine Learning Research 1 (2015): 1-48.
[3] Sameer Agarwal, Josh Wills, Lawrence Cayton, Gert Lanckriet, David J Kriegman, and Serge Belongie. Generalized non-metric multidimensional scaling. In International Conference on Artificial Intelligence and Statistics, pages 11–18, 2007. [4] Brian McFee and Gert Lanckriet. Learning multi-modal similarity. The Journal of Machine Learning Research, 12:491–523, 2011. [5] Omer Tamuz, Ce Liu, Ohad Shamir, Adam Kalai, and Serge J Belongie. Adaptively learning the crowd
673–680, 2011. [6] Laurens Van Der Maaten and Kilian Weinberger. Stochastic triplet embedding. In Machine Learning for Signal Processing (MLSP), 2012 IEEE International Workshop on, pages 1–6. IEEE, 2012. [7] Eric Heim, Matthew Berger, Lee Seversky, and Milos Hauskrecht. Active perceptual similarity modeling with auxiliary information. arXiv preprint arXiv:1511.02254, 2015.
New embedding algorithms: Classically formulated as a non-convex optimization. Modern papers propose new algorithms, convex relaxations and regularization methods, but do not mathematically embedding accuracy
Schultz, M., & Joachims, T. (2004). Learning a distance metric from relative comparisons. Advances in neural information processing systems (NIPS), 41.
is shoe A more like B or C ?
# samples / n hold-out error
hold-out error prediction accuracy vs. training samples this embedding predicts reasonably well, but are there many fundamentally different embeddings that are equally good?
ij = kxi xjk2 2
ij = (ei − ej)T K(ei − ej) , with K = XT X
ij < D? ik}
(1,0) (0,1) (-1,0) (0,-1)
ij < D∗ ik
ij > D∗ ik
D
t∈S
ij − D∗ ik
ik − D? ij
1 2 -
ij < D? ik ?
ij = kxi xjk2 2
ik − D? ij)
ik − D? ij)
ik − D? ij)
“i is probably closer to j” “i is probably closer to k”
ik − D? ij
1 2 -
ij − D? ik?
ik − D? ij) =
ik − D? ij
m
`=1
ijk
ik − D? ij
1 2 -
ik − D? ij)
ij − D? ik are invariant to the average distance
Different distances and embeddings, but the same differences of distances (all zero) !
“centered” distance matrix (measurable from differences) “mean” distance matrix (unobservable)
(1,0) (0,1) (-1,0) (0,-1)
energy outside 2 dimensions
(1,0) (0,1) (-1,0) (0,-1)
m
`=1
ijk ≈ f(D? ij − D? ik)
ij − D? ik ⇒ C?
F n2
D∈Dd,n
(i,j,k)∈S
n
i,j=1
ij|2 = O
D
t∈S
crowd’s effort need only scale linearly with number of items to be embedded average squared distance error
n
i,j=1
ij|2 = O
# of comparisons
n = 64 points in d = 2 dimensions with Ekxik2 = 1 and logistic model
http://www.newyorker.com/cartoons/vote Jamieson, K.G., Malloy, M., Nowak, R.D. and Bubeck, S.,
Armed Bandits. In COLT (Vol. 35, pp. 423-439). Jamieson, K.G., Jain, L., Fernandez, C., Glattard, N.J. and Nowak, R., 2015. Next: A system for real-world development, evaluation, and application of active learning. In Advances in Neural Information Processing Systems (pp. 2656-2664). Jain, L., Jamieson, K.G. and Nowak, R., 2016. Finite Sample Prediction and Recovery Bounds for Ordinal
Processing Systems (pp. 2703-2711).
model implicit knowledge? Similarity learning methods to assess perceptions of visual representations. In Proceedings of the 9th International Conference on Educational Data Mining.