
SLIDE 1
1 Laser Bathymetry
18 September 2013
2
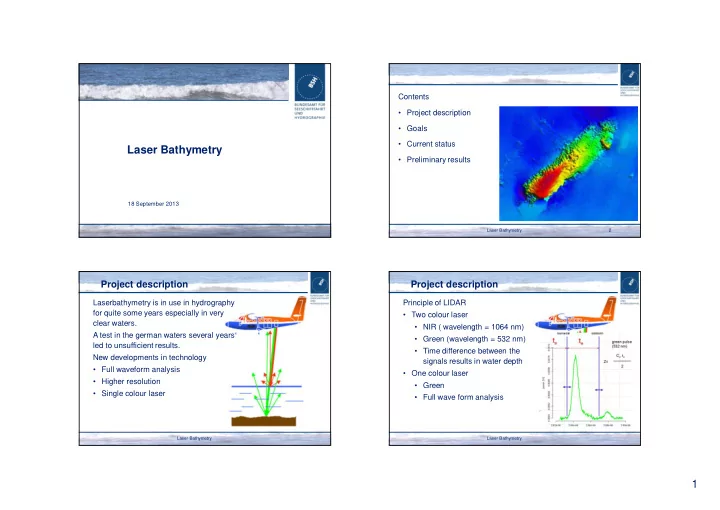
Contents
- Project description
- Goals
- Current status
- Preliminary results
Laser Bathymetry
Project description
Laserbathymetry is in use in hydrography for quite some years especially in very clear waters. A test in the german waters several years led to unsufficient results. New developments in technology
- Full waveform analysis
- Higher resolution
- Single colour laser
Laser Bathymetry
Project description
Principle of LIDAR
- Two colour laser
- NIR ( wavelength = 1064 nm)
- Green (wavelength = 532 nm)
- Time difference between the
signals results in water depth
- One colour laser
- Green
- Full wave form analysis
Laser Bathymetry