
KPI 1: Affordability
Annual 2017/18
(November 2018)
2017 2018 Variance RAG
▲
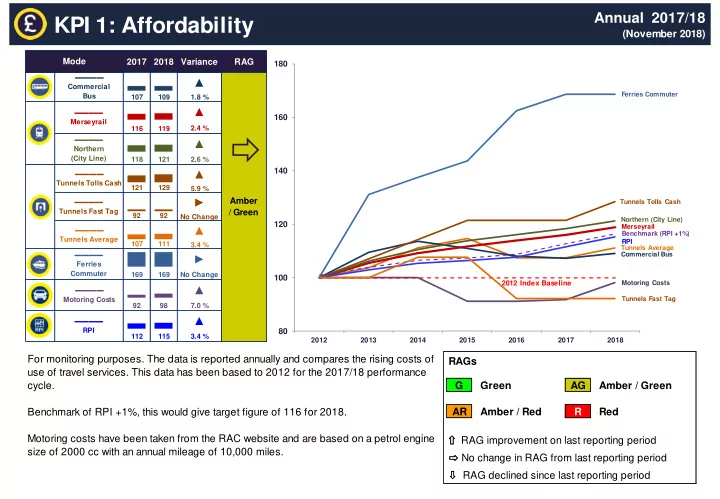
107 109 1.8 %
▲
116 119 2.4 %
▲
118 121 2.6 %
▲
121 129 5.9 %
►
92 92 No Change
▲
107 111 3.4 %
►
169 169 No Change
▲
92 98 7.0 %
▲
112 115 3.4 % ▬▬▬▬ RPI
Mode
▬▬▬▬ Commercial Bus
Amber / Green
▬▬▬▬ Merseyrail ▬▬▬▬ Northern (City Line) ▬▬▬▬ Tunnels Tolls Cash ▬▬▬▬ Ferries Commuter ▬▬▬▬ Motoring Costs ▬▬▬▬ Tunnels Fast Tag ▬▬▬▬ Tunnels Average
For monitoring purposes. The data is reported annually and compares the rising costs of use of travel services. This data has been based to 2012 for the 2017/18 performance cycle. Benchmark of RPI +1%, this would give target figure of 116 for 2018. Motoring costs have been taken from the RAC website and are based on a petrol engine size of 2000 cc with an annual mileage of 10,000 miles.
Tunnels Average Commercial Bus Merseyrail Northern (City Line) Tunnels Tolls Cash Ferries Commuter Motoring Costs RPI Benchmark (RPI +1%) Tunnels Fast Tag
80 100 120 140 160 180
2012 2013 2014 2015 2016 2017 2018 2012 Index Baseline
RAGs G Green AG Amber / Green AR Amber / Red R Red