
1/9/2012 1
Single Storm Event Loss Comparison to Total Annual Sediment and Nutrient Loss
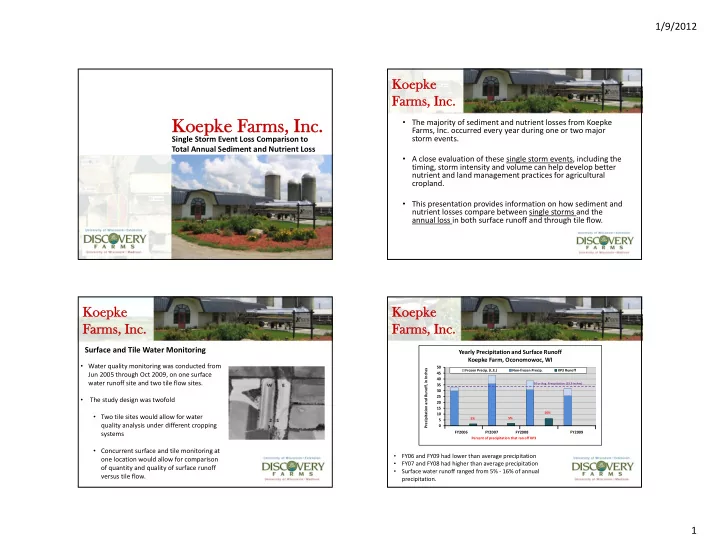
Koepk Koepke Farm Farms, Inc. s, Inc.
Koepke
Koepke Koepke Far Farms, Inc Inc.
- The majority of sediment and nutrient losses from Koepke
Farms, Inc. occurred every year during one or two major storm events.
- A close evaluation of these single storm events, including the
timing, storm intensity and volume can help develop better nutrient and land management practices for agricultural cropland.
- This presentation provides information on how sediment and
nutrient losses compare between single storms and the annual loss in both surface runoff and through tile flow.
Koepke
Surface and Tile Water Monitoring
- Water quality monitoring was conducted from
Jun 2005 through Oct 2009, on one surface water runoff site and two tile flow sites.
- The study design was twofold
- Two tile sites would allow for water
quality analysis under different cropping systems
- Concurrent surface and tile monitoring at
- ne location would allow for comparison
- f quantity and quality of surface runoff
versus tile flow.
Koepke Koepke Far Farms, Inc Inc.
- FY06 and FY09 had lower than average precipitation
- FY07 and FY08 had higher than average precipitation
- Surface water runoff ranged from 5% ‐ 16% of annual
precipitation.
Koepke Koepke Far Farms, Inc Inc.
5 10 15 20 25 30 35 40 45 50
FY2006 FY2007 FY2008 FY2009*
Precipitation and Runoff, in Inches
Yearly Precipitation and Surface Runoff Koepke Farm, Oconomowoc, WI
Frozen Precip. (L.E.) Non‐frozen Precip. KP3 Runoff 5% 5% 16%
30‐yr Avg. Precipitation (33.9 inches)
Percent of precipitation that ran off KP3 FY2006 FY2007 FY2008 FY2009