
SLIDE 1
1/9/2012 1
Water Budget at Koepke Farms, Inc.
Koepk Koepke Farm Farms, Inc. s, Inc.
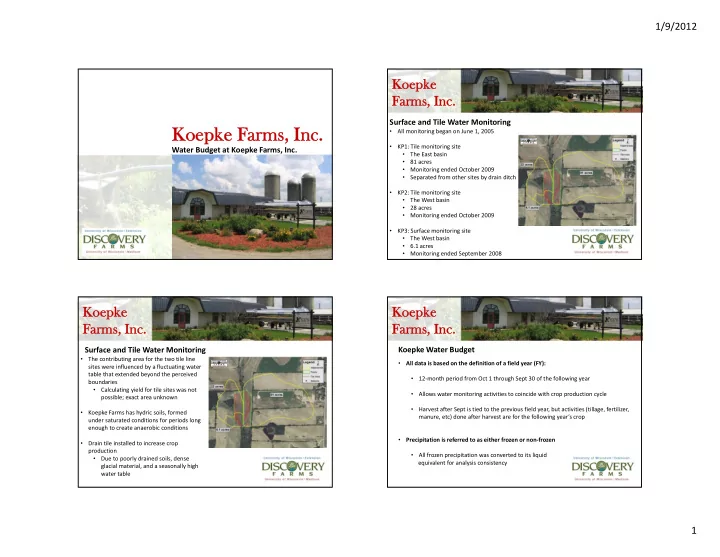
Surface and Tile Water Monitoring
- All monitoring began on June 1, 2005
- KP1: Tile monitoring site
- The East basin
- 81 acres
- Monitoring ended October 2009
- Separated from other sites by drain ditch
- KP2: Tile monitoring site
- The West basin
- 28 acres
- Monitoring ended October 2009
- KP3: Surface monitoring site
- The West basin
- 6.1 acres
- Monitoring ended September 2008
Koepke Koepke Far Farms, Inc Inc.
Surface and Tile Water Monitoring
- The contributing area for the two tile line
sites were influenced by a fluctuating water table that extended beyond the perceived boundaries
- Calculating yield for tile sites was not
possible; exact area unknown
- Koepke Farms has hydric soils, formed
under saturated conditions for periods long enough to create anaerobic conditions
- Drain tile installed to increase crop
production
- Due to poorly drained soils, dense
glacial material, and a seasonally high water table
Koepke Koepke Far Farms, Inc Inc.
Koepke Water Budget
- All data is based on the definition of a field year (FY):
- 12‐month period from Oct 1 through Sept 30 of the following year
- Allows water monitoring activities to coincide with crop production cycle
- Harvest after Sept is tied to the previous field year, but activities (tillage, fertilizer,
manure, etc) done after harvest are for the following year’s crop
- Precipitation is referred to as either frozen or non‐frozen
- All frozen precipitation was converted to its liquid
equivalent for analysis consistency